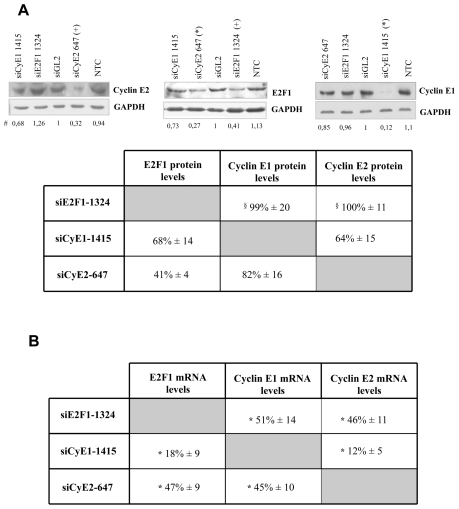
Figure 5. Interrelation among E2F1, cyclin E1 and E2 in CSMCs.
Three days after trasfection, each of the target gene was depleted by the respective siRNAs and the protein levels (A) of the other two target genes evaluated: in the upper panel representative blots out of three independent experiments are reported (CSMCs from donor 2), in the lower panel the total data are shown (CSMCs from donors 1 and 2); # all the numbers reported below the blots are derived from band quantification normalized to GAPDH and are expressed as ratio of siGL2 treatment; § protein levels were reduced at day five post transfection; B) the mRNA levels corresponding to the data shown in A) are reported (28S transcript levels served as normalizator); cumulative data from both donors are expressed as mean ± SEM, n = 6. * p< 0.05 compared to control.

