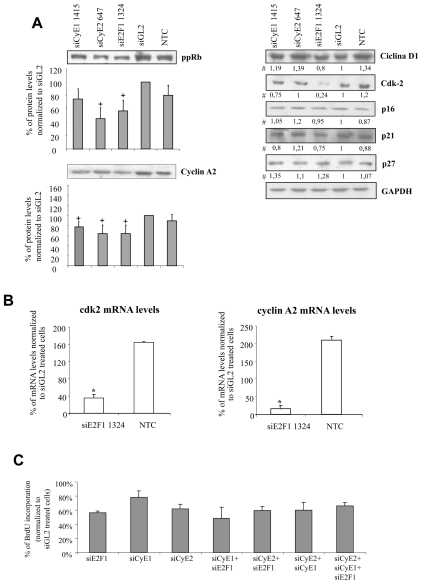
Figure 6. Expression levels of different cell cycle regulators following E2F1, cyclin E1/E2 depletionand effect of the combined administration of different siRNAs on BrdU incorporation.
A) Three days after transfection, the protein levels of different cell cycle regulators were measured in protein extracts obtained from CSMCs of donor 2: shown are representative blots; # all the numbers reported below the blots derive from band quantification normalized to GAPDH and are expressed as ratio of siGL2 treatment; for ppRb (hyper-phosphorylated pRB) and cyclin A2, whose phosphorylation status and protein levels, respectively, were modified, cumulative data are reported as ratio to GAPDH; data are expressed as means ± SEM, n=3, + p< 0.05 compared to control; B) mRNA levels of cyclin A2 and Cdk2 were measured in CSMC treated with siE2F1-1324 in total RNA extracts obtained from both donors (28S transcript levels served as normalizator); results are expressed as means ± SEM, n=6, * p< 0.05 compared to control. C) CSMCs were treated by a mix of the different siRNAs (115 or 76 nM each in the case of a combination of two or three siRNA, respectively) and CSMC proliferation evaluated by BrdU incorporation; the effects of the combined administration were compared to an equimolar concentration of each of the single siRNAs (230 nM each) three days after transfection; NTC = non-treated cells, siGL2 = control siRNA treated cells; cumulative data from donor 1 and 2 CSMCs are expressed as means ± SEM, n=3.

