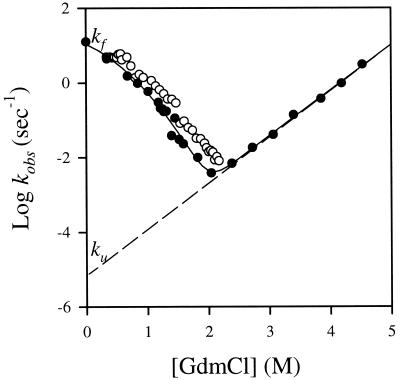
Figure 1.
Chevron curves of wild-type barnase at 25°C and pH 6.3 (solid circles) and pH 7.23 in the presence of 0.1 M Na2SO4 (open circles). The solid curve is the best fit of the observed rate constants to a three-state model with Eqs. 1–3. It yields the following values: KIU = 0.009; mIU = 4.05 M−1; kIN = 11.9 s−1; mIN = 2.63 M−1; kNI = 8.6 × 10⁻⁶ s−1; mNI = 2.80 M−1; mNU (sum of mIU, mIN, and mNI) = 9.49 M−1; and mIU/mNU = 0.43. The dashed line illustrates the linear extrapolation of unfolding rate constant log ku. It should be noted that the ku in water, obtained with guanidinium chloride (GdmCl) and linear extrapolation, is 10 times smaller than the value obtained with urea (1).

