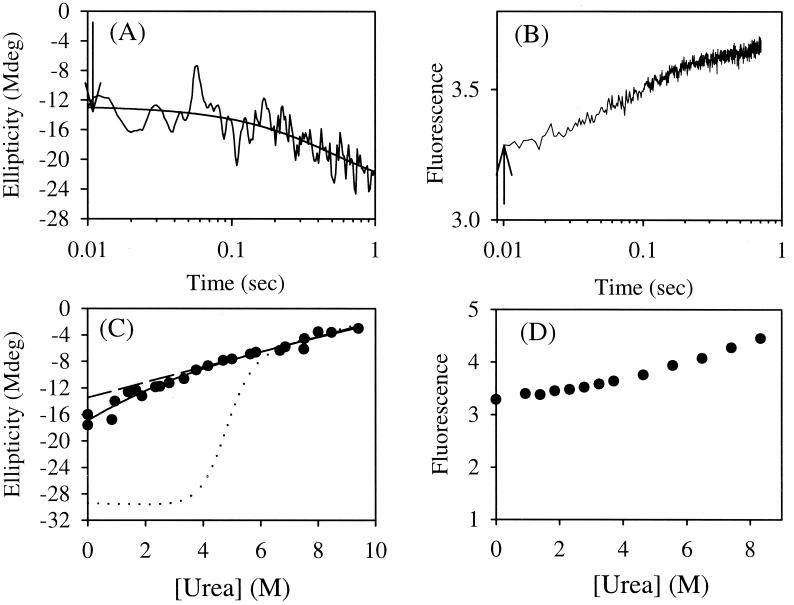
Figure 3.
Noncooperative unfolding of the postulated intermediate. Kinetic traces generated by the stopped-flow CD at 0.94 M urea (A) and fluorescence in water (B) at pH 6.3 and 25°C. The values at 10 ms of folding as indicated by the arrows at different urea concentrations were plotted in C (solid circles) and D (solid circles). The global unfolding of barnase is shown with the dotted line. The curved solid line is the fitting curve with a two-state model with parameters for both pretransition and posttransition baselines (see Materials and Methods). The dashed line represents the posttransition baseline. Mdeg, millidegree.

