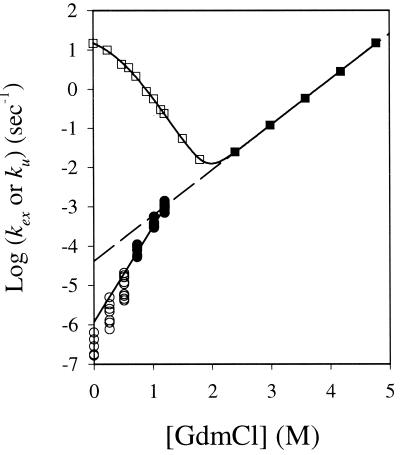
Figure 4.
Downward deviation of the log ku at 30°C and pD 6.8 (pDread + 0.4) in D2O. The open and filled squares are rate constants measured by using stopped-flow fluorescence under the conditions used in the native-state HX experiments (9). The open and filled circles represent the HX rate constants of the slowly exchanging amide protons measured at GdmCl concentrations from 0.0 to 0.51 M and from 0.73 M to 1.20 M, respectively (9). The convergence of the exchange rate constants of the 13 amide protons at above 0.51 M GdmCl is indicative of EX1 exchange mechanism. The solid straight line represents the linear fitting of the filled circles with a slope of 2.425 and an intercept of −5.924. The dashed line is the linear fitting to the log ku at higher GdmCl concentrations.

