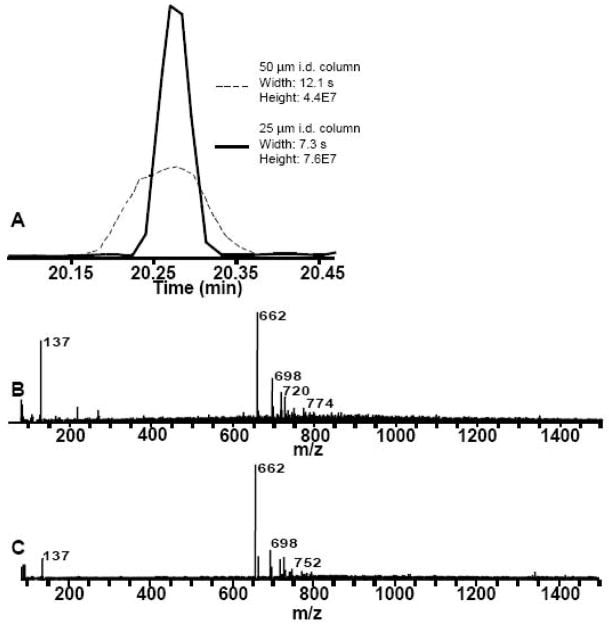
Figure 3.
Effect of decreasing column I.D. on peak signal and mass spectrum.
A. Reconstructed ion chromatogram of 662 m/z from 50 μm I.D. and 25 μm I.D. column. B. Average mass spectrum over width of 662 m/z peak from 50 μm I.D. column. C. Average mass spectrum over width of 662 m/z peak from 25 μm I.D. column. Comparison of B and C illustrates fewer adducts to the 662 m/z peak and a 73% increase in signal intensity.

