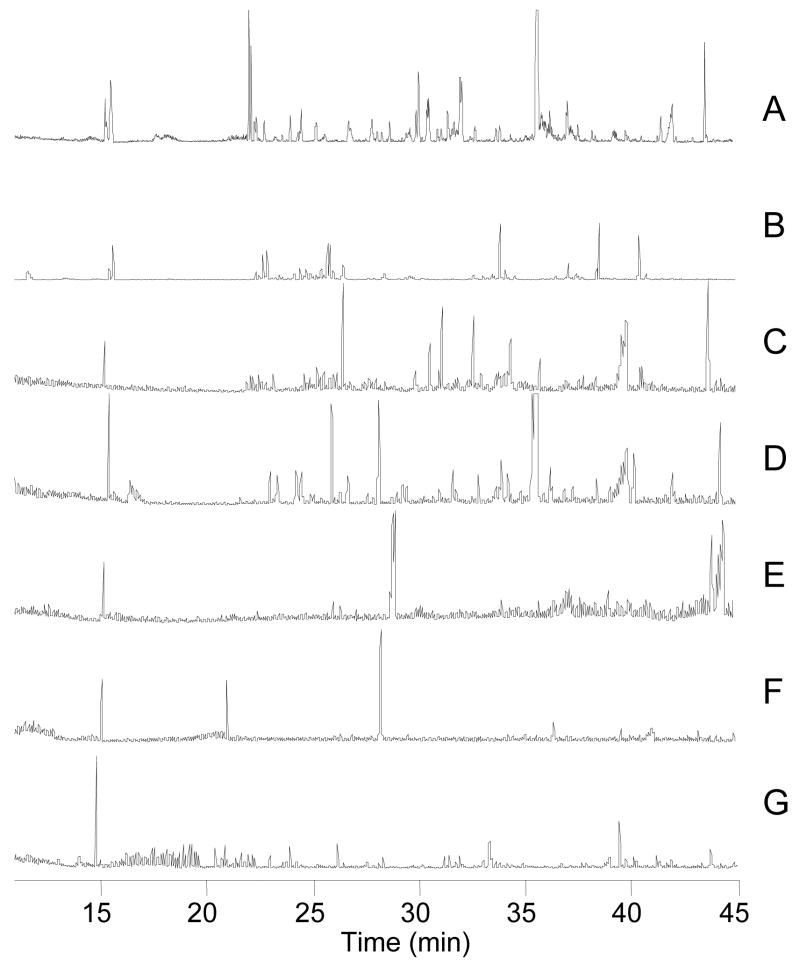
Figure 6.
Base peak chromatograms from 1D and 2D separation of small molecules from 50 islets of Langerhans. Experiment performed as in Figure 6. [Brackets] indicate the average number of small molecules detected. A:1-D RPLC-MS [191] B-G 2-D SAX-RPLC B: 5 mM NH4HCO2 fraction [155] C. 100 mM NH4HCO2 fraction [70] D. 200 mM NH4HCO2 fraction [73] E. 300 mM NH4HCO2 fraction [41] F. 400 mM NH4HCO2 fraction [36] G. 500 mM NH4HCO2 fraction [18].

