
Figure 2.
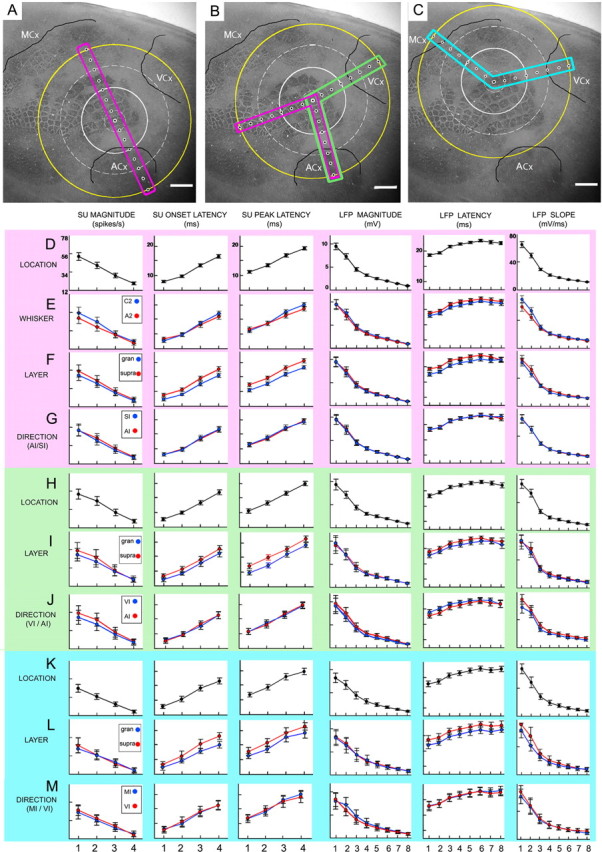
Change in evoked responses across location is similar regardless of whisker, layer, or direction. A–C, Schemes of recording locations whose first electrode registered with whisker A2 (A), C2 (B), or E2 (C) barrels. Boxes are color-coded to indicate Data A (pink), B (green), or C (blue). Extrapolated white circles are based on percentage of rats with evoked SU at a given distance: 100% = small, dashed; >50% = medium, solid; and farthest electrode with measurable SU = large, dashed. Extrapolated yellow circle is based on 100% of rats exhibiting evoked LFP at the farthest location. Scale bars, 1 mm. D–G, Detailed plots of SU and LFP response properties are provided for Data A, across location (D) and then subdivided by whisker (E), layer (F), or direction (G). Note expected latency differences between layers (F). H–M, Except for subdivision by whisker, respective plots for Data B (H–J) and C (K–M) are provided.