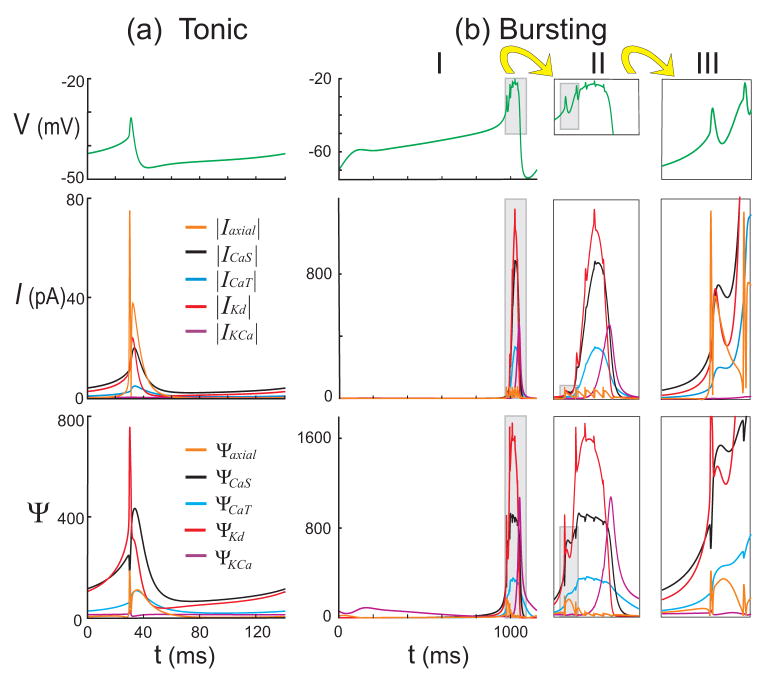
Figure 4.
Comparative measures of influence of the most influential variables for (a) the tonic and (b) the bursting regimes. The regions shown in gray boxes in (b)I are expanded in II; they show activity during the active phase of a burst (with a time range 960 to 1100 ms). Similarly, gray boxes in (b)II are expanded in III to show the first two spikes of the active phase in the same scale as (a). Variables were considered non-significant if their current magnitudes and Ψ values were at least a factor of ε =1/5 smaller than the largest. Top panels: S/N voltage traces for reference. Middle panels: current magnitudes over one cycle. Bottom panels: Ψ values over one cycle.

