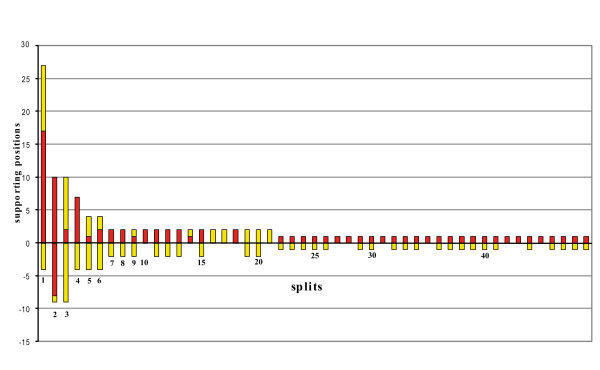
Figure 4.
Spectrum of split-supporting positions as estimated with SAMS. Column height represents the number of clade-supporting positions, i.e. putative primary homologies. Column parts above the y axis represent the best supported of the two groups of a split, the part below the axis corresponds to the second group. Red: asymmetrical positions (conserved character state only in functional ingroup); yellow: noisy positions (more than one character state in functional in- and outgroup; see Wägele and Rödding 1998a, b). The first ten columns represent the best supported splits and contain the following groupings: 1: Cellana sp.+ Eulepetopsis vitrea; 2: Coleoida; 3 Coleoida + Creseis sp; 4: Nautilus pompilius + Nautilus scrobiculatus; 5: Cephalopoda; 6: Cephalopoda + Creseis sp.; 7: Paranerilla limicola + Chaetoderma nitidulum; 8: Chamelea striatula + Corbicula spp + Mercenaria mercenaria; 9: Cellana sp.+ Eulepetopsis vitrea + Coleoida; 10: Cellana sp. + Eulepetopsis vitrea + Creseis sp. + Laevipilina antarctica. No split was detected that unites Laevipilina and Polyplacophora.

