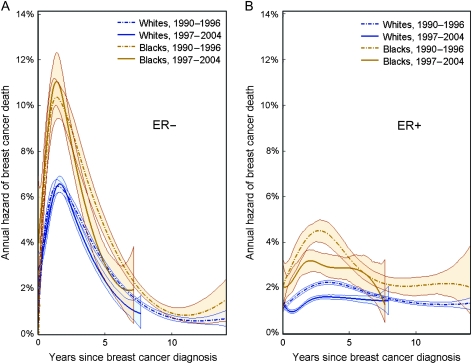
Figure 3.
Annual hazard rates of breast cancer death (percentage of breast cancer dying per year among women living with the disease) are plotted against years since diagnosis for black women (orange) and white women (blue) for two calendar periods: 1990–1996 (broken lines) and 1997–2004 (solid lines). A) Hazard rates among case subjects with estrogen receptor–negative (ER−) tumors. B) Hazard rates among case subjects with estrogen receptor–positive (ER+) tumors.

