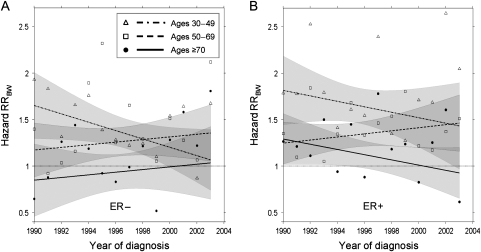
Figure 4.
Black-to-white breast cancer hazard rate ratios (RRsBW). Hazard RRsBW are plotted for three age groups. A) Estrogen receptor–negative (ER−) tumors. B) Estrogen receptor–positive (ER+) tumors. In each panel, observed values (dots, ages ≥70 years; squares, ages 50–69 years; and triangles, ages 30–49 years) are shown along with the corresponding fitted trends (solid line, dashed line, and dot–dash line, respectively) with 95% confidence intervals (shaded areas). Broken black line indicates an RRBW = 1.

