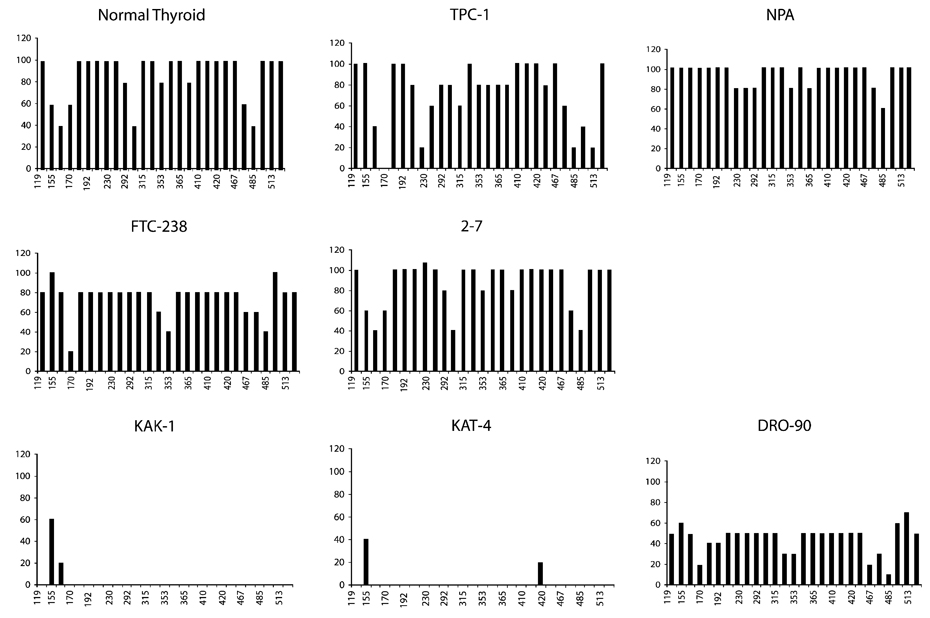
Fig. 2.
Methylation frequency at the 27 CpG sites in the 14-3-3σ gene. The X-axis represents the nucleotide position relative to the transcription start site (as previously described) [20], and the Y-axis represents the % methylation at that site. The upper two panels represent 14-3-3σ non-expressers, whereas the lower panel depicts the cell lines expressing 14-3-3σ mRNA.

