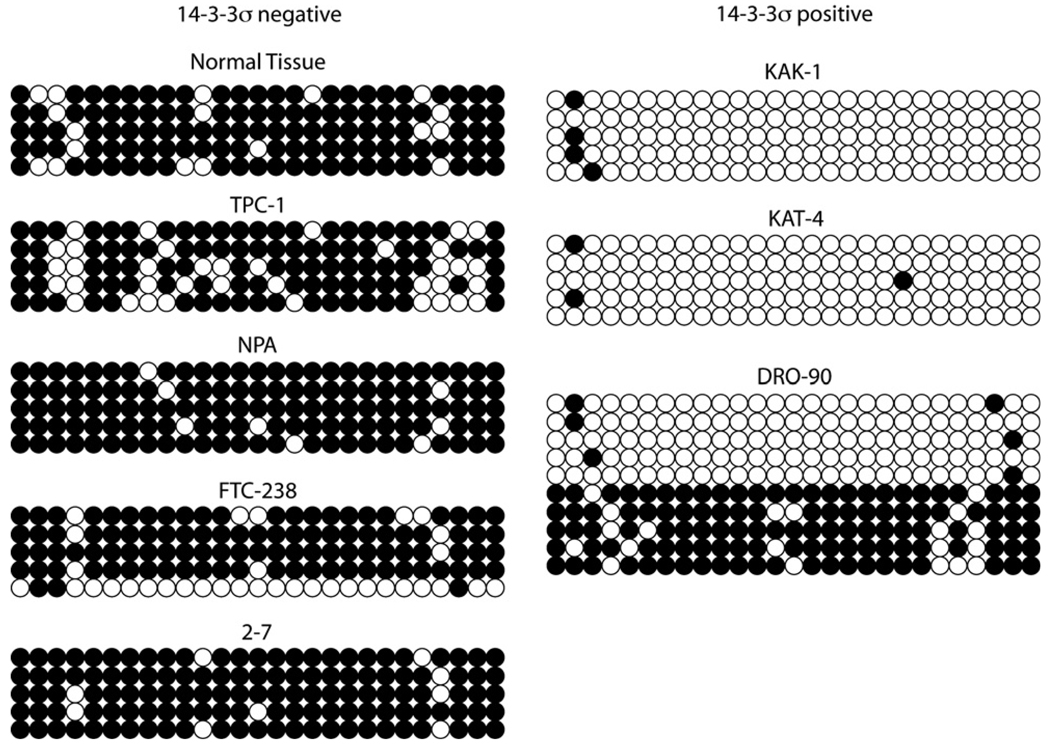
Fig. 3.
Bisulfite sequencing of the 14-3-3σ promoter in normal thyroid tissues and cell lines. The bubble charts show the methylation status of each of the 27 CpGs in the CpG island at the positions indicated in Fig. 2. Dark circles represent methylated cytosines, whereas open circles represent unmethylated cytosines. Each row represents a single sequenced amplicon.

