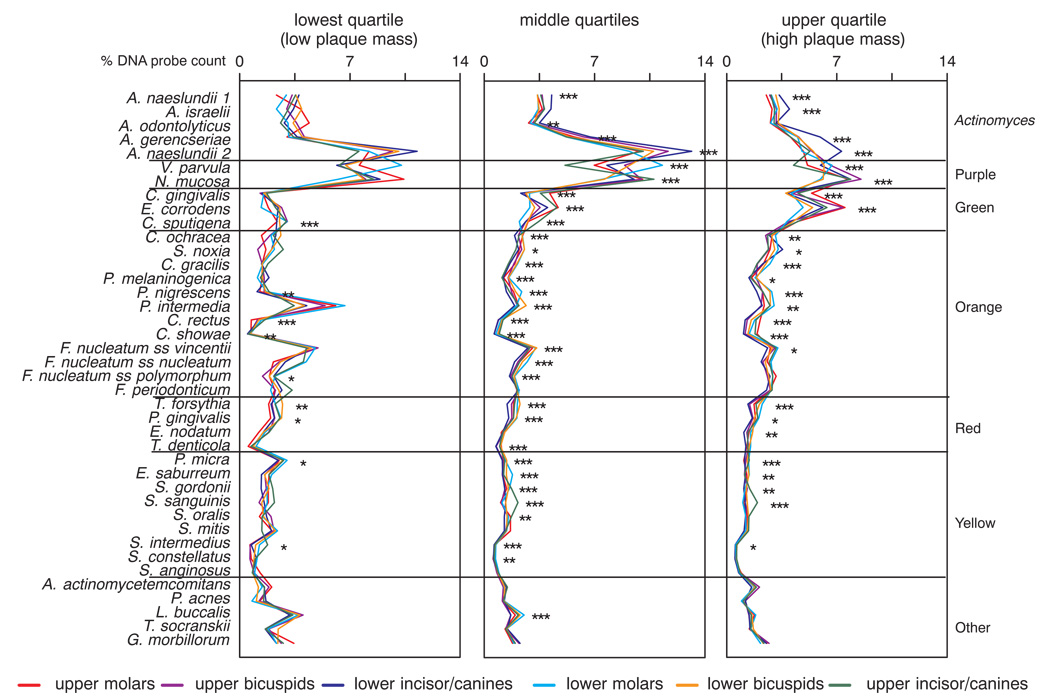
Fig 7.
Mean % DNA probe counts of the 40 test species in supragingival biofilm samples subset according to the quartiles of total DNA probe count. Species proportions were averaged within each quartile group for each tooth category in each subject and then across subjects for each tooth category/total DNA probe count quartile separately. The species were ordered according to supragingival microbial complexes (1). The left panel represents mean species proportions in different tooth categories in samples with the lowest plaque mass (the lowest quartile of total DNA probe counts), the right panel represents mean species proportions for different tooth categories in samples with the highest plaque mass (the highest quartile of total DNA probe counts), while the middle panel represents the remaining 50% of the distribution. The different colored lines in each panel represent the various tooth categories. Significance of differences among tooth type categories for each of the test species in each total DNA probe count quartile was determined using the Kruskal Wallis test and adjusted for 40 comparisons: * p < 0.05; ** p < 0.01; *** p < 0.001.

