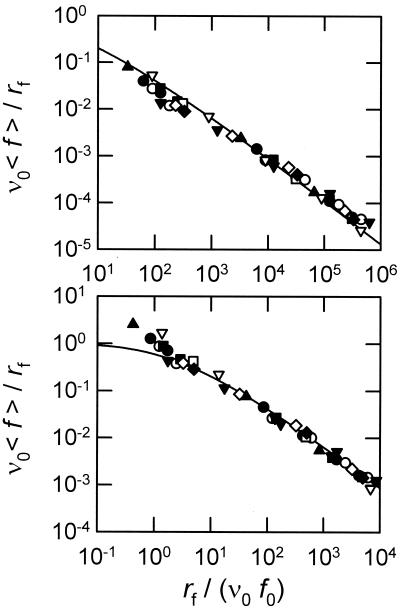
Figure 7.
Illustration of the effect of a change in ν0 on the agreement of the experimental data with the theoretical predictions of Eq. 6. (Upper) ν0 = 0.02 s−1, i.e., 10 times smaller than the optimal value used in Fig. 5. (Lower) ν0 = 0.64 s−1. Both cases correspond to the distance domain 0–100 nm and to Ω2 ≈ 5, whereas the minimum of Ω2 was found to be 2.39.

