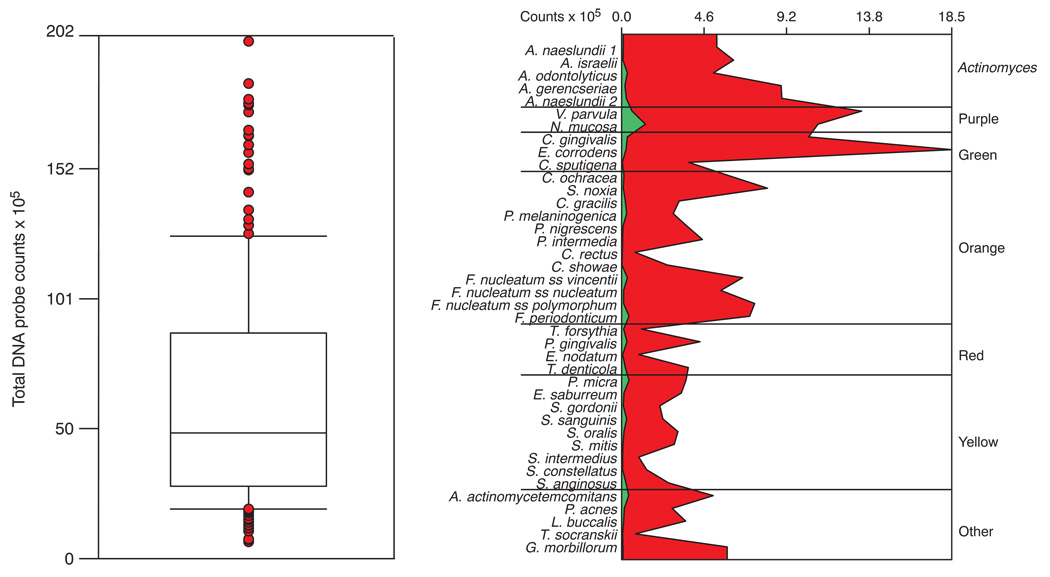
Fig. 1.
Tukey box plot demonstrating the distribution of the mean total DNA probe counts of supragingival biofilm samples for the 187 subjects (left panel). The box indicates the upper and lower quartile values, the horizontal line within the box represents the median value. The whiskers indicate the 10th and 90th percentiles and the circles present the values for individual subjects who were outside the 10th and 90th percentiles. The right panel presents the mean counts (× 105) of each of the 40 test species in the subject with the lowest mean total DNA probe counts (green panel) and the subject with the highest mean total DNA probe counts (red panel). Counts of individual species in samples from all teeth (excluding third molars) were averaged within each subject separately. The species are ordered according to supragingival microbial complexes (7).

