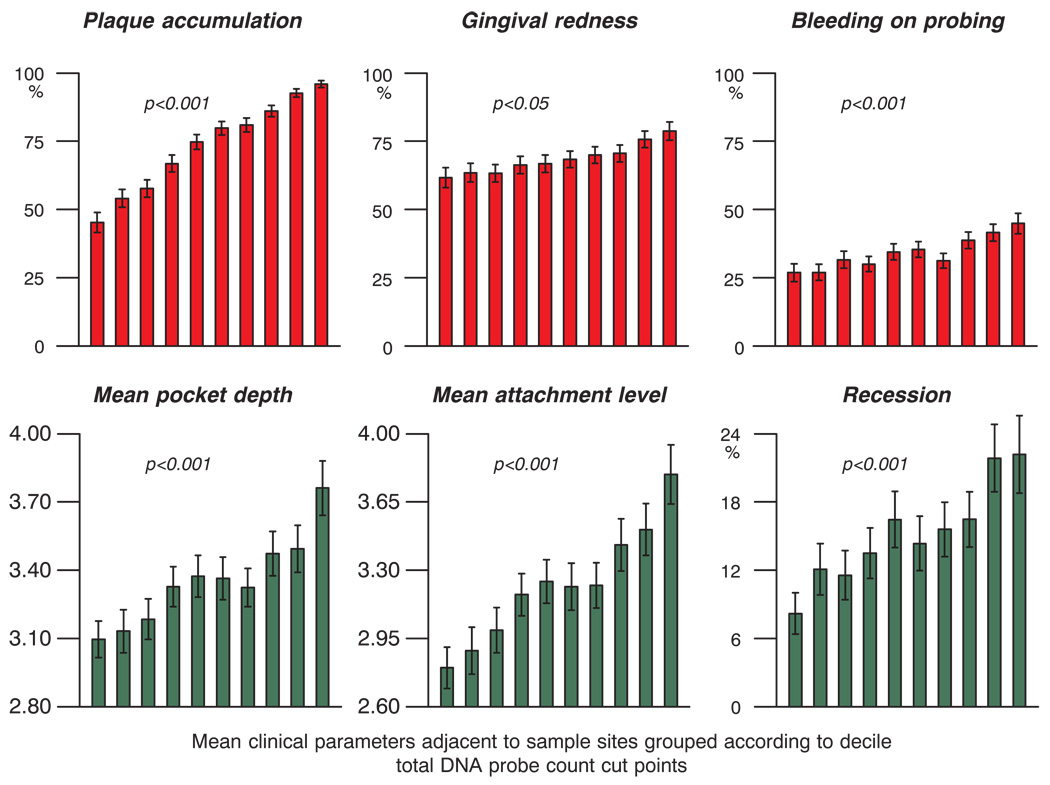
Fig. 7.
Bar charts of the mean total DNA probe counts at sites subset according to pocket depth categories < 4, 4–6 and > 6 mm and presence or absence of gingival redness (left panel) or bleeding on probing (right panel). 2-way ANOVA indicated that total DNA probe counts differed significantly among pocket depth categories and also between presence or absence of gingival redness, or between presence or absence of bleeding on probing.

