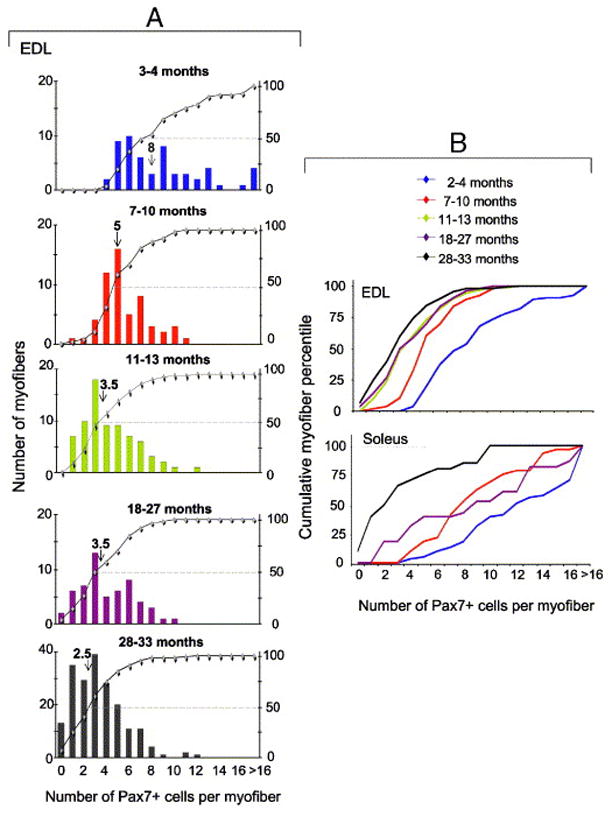
Fig. 2.

Satellite cell abundance in freshly isolated EDL and soleus myofibers. Satellite cells were enumerated by Pax7 immunolabeling. The number of mice and myofibers used in each analysis along with descriptive statistics are detailed in Table 1. Panel A depicts the distribution of individual EDL myofibers of young, adult (2 age subgroups), old and senile mice. The X-axis shows the number of satellite cells per myofiber. In each inset, myofibers are ranked from left to right according to the number of resident satellite cells they contain. The left Y-axis represents the number of myofibers and each bar shows the number of myofibers with a certain number of satellite cells. The right Y-axis represents the cumulative percentage of individual ranks relative to the total number of myofibers (–◆–); each data point reflects the percent of myofibers with the number of Pax7+ cells corresponding to this data point (as presented in the X-axis) plus all the myofibers with a lower number of satellite cells. For example, in the top panel of Fig. 2A (3–4 month old mice) 25% of the myofibers contain up to 5 Pax7+ cells and 50% of the myofibers contain up to 7 Pax7+ cells. The median number of satellite cells per myofiber is depicted in each inset by an arrow and the median value is depicted above the arrow. Panel B depicts relative cumulative plots of the distribution of EDL and soleus myofibers of all age groups together. EDL data depicted in panel B are based on those shown in each inset of A and are compiled together for comparing the kinetics of satellite cells from EDL and soleus muscle. Soleus data were compiled in the same manner as the EDL data by increments of one satellite cell at a time along the X-axis. The average number of satellite cells per each age group and muscle type and statistical analyses of the differences between the groups are included in Table 1.
