
Fig. 4.
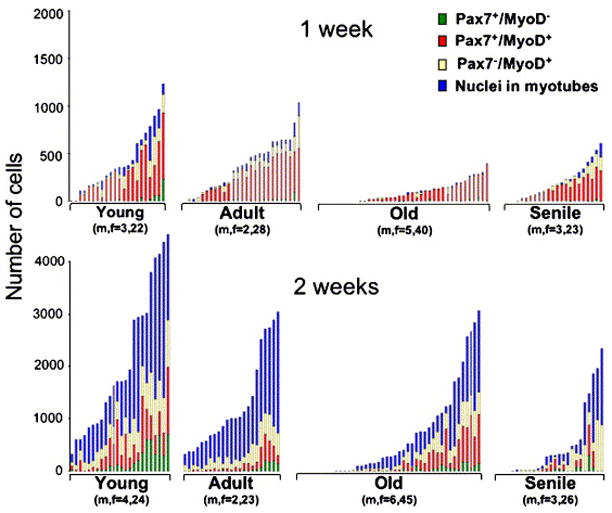
Progression of satellite cell progeny through myogenesis in cultures emanating from individual EDL myofibers. Each stacked bar represents the distribution of cells within a single myofiber culture. The number of mice (n) and the number of myofibers (f) per age group is listed under the respective inset. Data collected by double-immunolabeling and DAPI-counterstaining are shown for 1- and 2-week old cultures (top and bottom panels, respectively). In the inset of each age group, individual myofiber cultures were ranked from left to right according to the total number of myogenic nuclei they encompass. The height of each bar represents the total number of myogenic cells in the corresponding myofiber culture and the different segments in each bar represent the number of cells in each of the four distinct myogenic compartments analyzed. Myofibers that did not give rise to cells are ranked at the left part of each inset. Additional analysis of the data is included in Table 2.