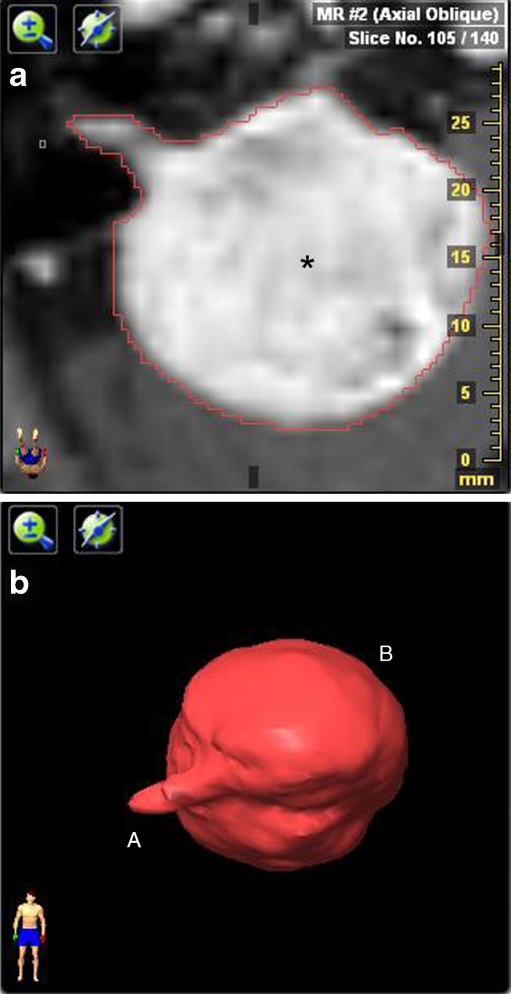
Fig. 2.
a: Example of area tracing with volume software. Axial contrast-enhanced T1-weighted image shows a right-sided vestibular schwannoma (asterisk) with a large cerebellopontine angle component. The red line is the result of the autotracer which lines the vestibular schwannoma. b Three dimensional representation of a vestibular schwannoma (VS), integrating the surface of all slice intervals. The small intracanalicular (A) and large extracanalicular (B) portion of the VS can easily be identified

