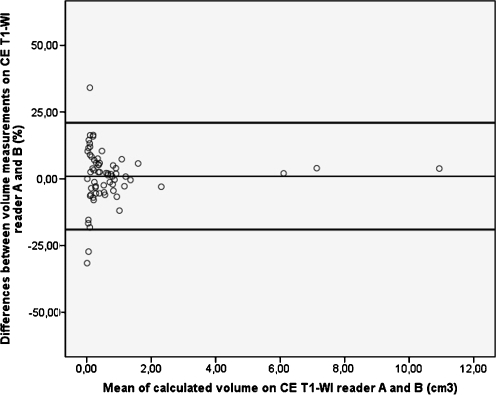
Fig. 4.
Bland and Altman plot of baseline volume measurements on contrast-enhanced T1-weighted images (CE T1-WI). The values on the Y-axis represent the measurement differences between the two readers and their mean difference (thin line). The values on the X-axis represent the mean of both measurements. The thick black lines represent the 95% limits of agreement. Interobserver differences are larger in smaller vestibular schwannomas

