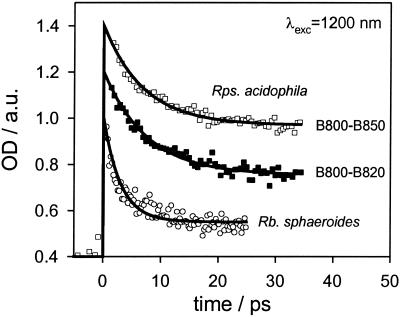
Figure 4.
Time dependence of ESA (λdet = 550 nm) along with monoexponential fits with constant offset of the B800-B850 complex (□, τS1 = 7 ± 0.5 ps) and the B800-B820 complex (■, τS1 = 7.5 ± 0.5 ps) of Rps. acidophila and LH2 of Rb. sphaeroides (○, τS1 = 3 ± 0.5 ps) observed after TPE (λexc = 1,200 nm). The traces have been normalized and offset from each other by 0.2.

