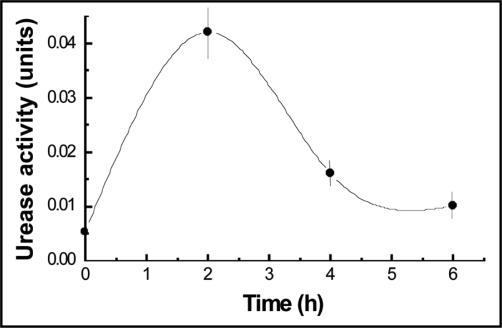
Figure 3.
Time course of urease extracted from isolated cells walls of P. canina cyanobionts obtained from thalli floated 50 mM phosphate buffer, pH 6.9, containing 40 mM urea, at 30°C in the dark. Values are the mean of three replicates. Vertical bars give standard error where larger than the symbols.

