
Fig. 2.
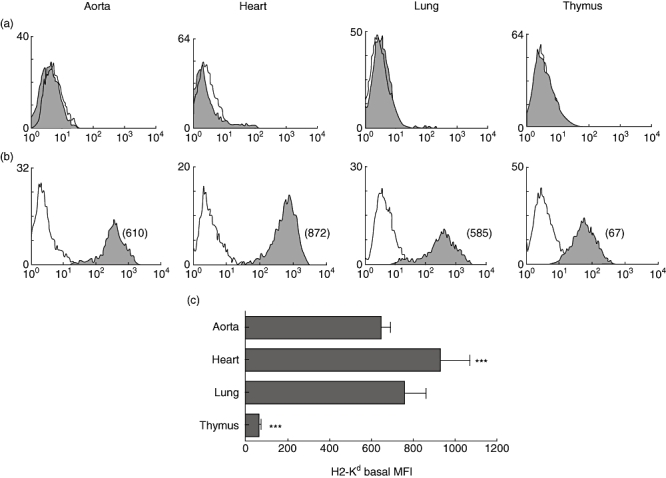
Tissue-specific expression of major histocompatibility complex (MHC) molecules. Figure shows comparative flow cytometric analyses of MHC class II (a) and MHC class I (b) molecules on aortic, heart, lung and thymic endothelial cells (ECs) derived from non-obese diabetic (NOD) mouse. The mean fluorescence intensity (MFI) of each peak is shown in parentheses. Empty histograms represent isotype control staining. Study data are representative of at least three separate flow cytometric analyses carried out on ECs from at least five independent sets of experiments (where one set of experiments is the characterization of ECs isolated from three mice). Cumulative data from these independent experiments are represented in (c), and show significant heterogeneity in MHC class I expression (***P < 0·0001) among the tissues examined. Bars represent means of MFIs; error bars represent standard error of the mean (s.e.m.).