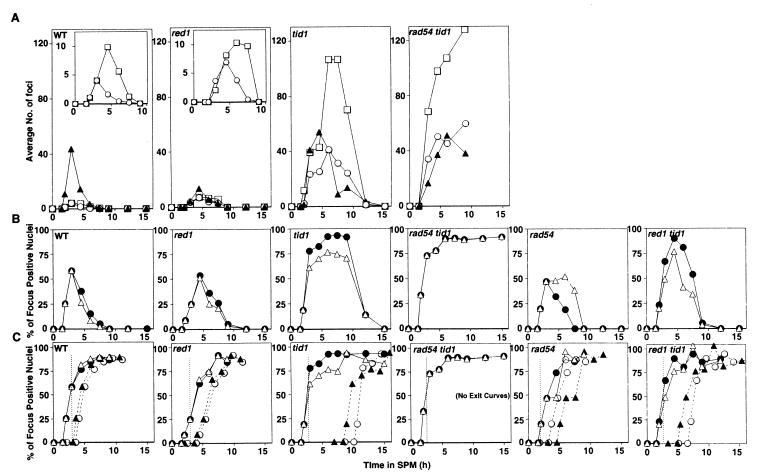
Figure 2.
(A) Time course analysis of Rad51 and Dmc1 foci. One hundred nuclei were randomly selected. The number of foci in each of the three possible focus classes, RD foci (closed triangles); R foci (open circles), and D foci (open squares), were counted in each nucleus examined. The average numbers of the foci at each time point are shown. (B and C) Time course analysis of Rad51 and Dmc1 focus-positive nuclei. The percentages of nuclei containing more than five foci were derived from the images of more than 100 random nuclei from each time point. The threshold of five is set to avoid including nuclei that display a small amount of background staining in the focus-positive class (ref. 26; and M.S., unpublished data). Noncumulative curves (B) are converted into cumulative curves (C) by using the method of Padmore et al. (44). The duration of a stage is given by the area under the corresponding noncumulative curve, divided by the total fraction of nuclei progressing through meiosis (44), assumed to be 90% at all time points. The average life span of Rad51-positive nuclei was 1.77 ± 0.24 h (n = 7). Cumulative curves describe what fraction of cells have either entered or completed a given event as a function of time. The curve is identical to the noncumulative curve plotted up to the first nonzero time point and one life span thereafter. Then, for any time point (t) after one life span has elapsed, the cumulative curve value at t is equal to the noncumulative curve value at t plus the cumulative curve value at t minus one life span. The exit curve for any event is given by plotting entry curve at a rightward displacement along the x axis by one life span. From the left: WT, red1, tid1, rad54 tid1, rad54, and red1 tid1 mutants. In B, percentages of R+ and D+ nuclei are indicated by open triangles and closed circles, respectively. In C, the fraction of nuclei that had entered R+ and D+ stages are indicated by open triangles and closed circles, respectively. The fraction that had exited R+ and D+ stages are indicated as hatched lines with closed triangles and open circles, respectively. The vertical line in each panel highlights the 3-h time point. Construction of cumulative curves assumes that the life span of a particular stage is constant as time progresses. The bi-phasic shape of the R+ curve in the tid1 mutant suggests that the life span of this stage is not uniform in this mutant.

