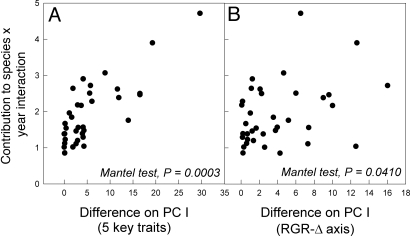
Fig. 3.
Species differences in response to yearly variation are correlated with differences in position along the first principal component of variation in 5 key functional traits that underlie a growth capacity/low-resource tolerance tradeoff (leaf mass ratio, maximum electron transport capacity, specific leaf area, relative growth plasticity and leaf nitrogen content) (A) and differences in position along the first principal component constructed using relative growth rate and intrinsic water-use efficiency alone (B). Each point represents the pairwise squared difference between 2 species. Significance was tested with Mantel permutation tests to account for non-independence of data points.

