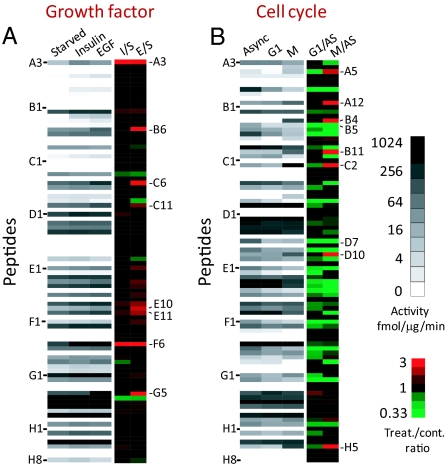
Fig. 3.
Peptide phosphorylation rates accurately report pathway activation states. (A) Intensity map of kinase activities of starved (S), insulin-stimulated (I), and EGF-stimulated (E) HEK293 cells (average of triplicate experiments). Fold change over the starved state is shown. Peptides with signals below detection threshold were not included for ratio calculation. (B) Intensity map of kinase activities of asynchronously growing (AS) HeLa cells, and cells arrested in either G1/S or G2/M phase of the cell cycle. Fold change over the asynchronous state is shown. Peptides were ordered according to their positions in the 96-well plate. Sequences of all peptides can be found in Table S1.

