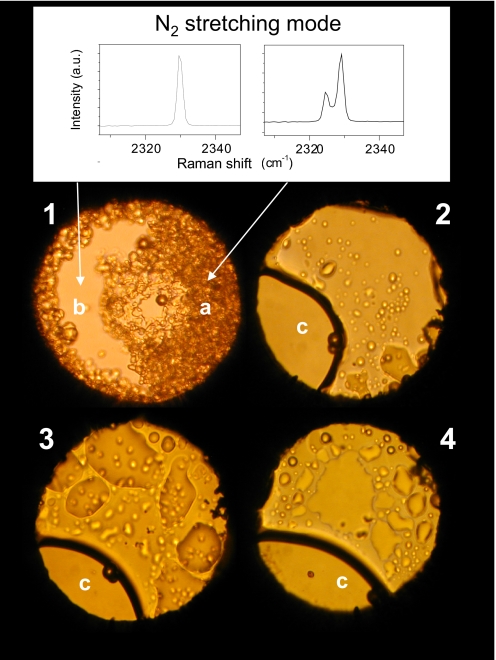
Fig. 1.
Photomicrographs illustrating the history of the N2/H2O mixture. (1) The sample at 0.6 GPa after the loading. The Raman spectra clearly show that the b region is mainly fluid nitrogen, whereas the solid fraction a is the nitrogen clathrate hydrate (28). (2) At 0.1 GPa after the clathrate decomposition and before the irradiation cycles. The c region is essentially composed of water. (3) After 3 h of irradiation with 500 mW of the 350-nm line focused to irradiate all of the sample (150 μm in diameter). (4) After 5 additional hours of irradiation with 200 mW focused in the nitrogen-rich region to a spot of 40 μm to increase the power density by a factor 6 with respect to the previous irradiation cycle.

