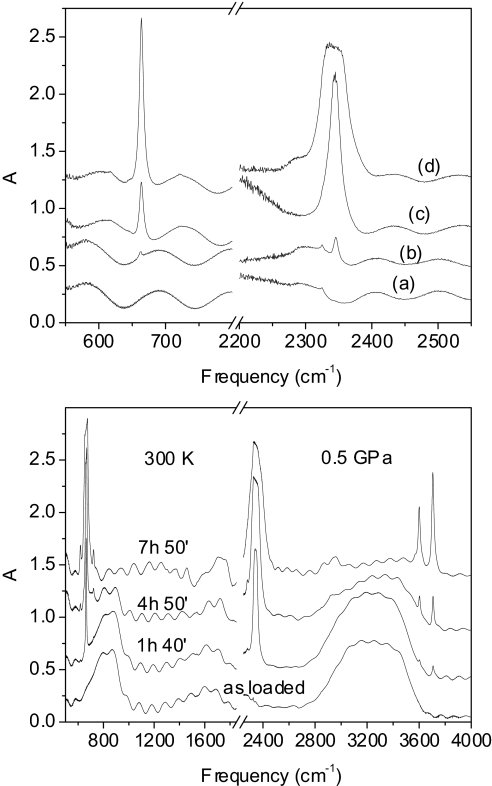
Fig. 4.
Monitoring the reaction of the CO/H2O mixture by FTIR spectra. (Upper) CO2 bending (Left) and antisymmetric stretching (Right) regions measured at 0.5 GPa immediately after the loading of the mixture (line a); after the mixture has been kept 64 h at 0.45 GPa and 21 h at 0.65 Gpa (line b); in pure CO after 3 h irradiation with 100 mW of the 350-nm line (line c); in the mixture after irradiation in the same conditions as line c (line d). (Lower) Evolution of the IR spectrum of the CO/H2O mixture as a function of the irradiation time. The spectra are measured after irradiation with 100 mW of the 350-nm line for the reported duration.

