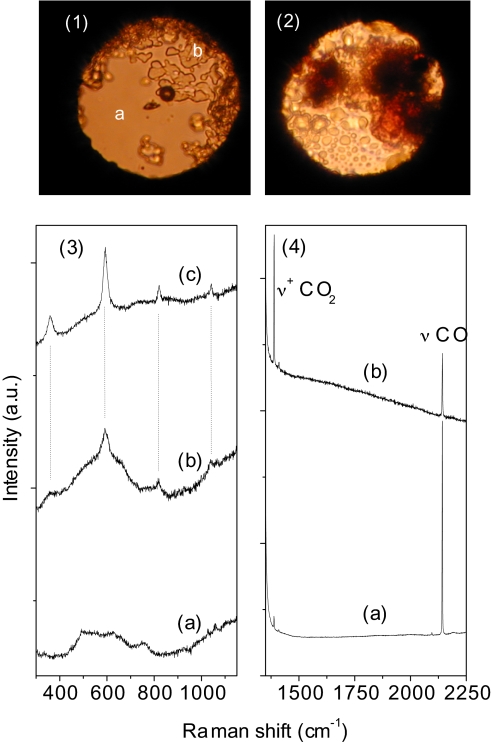
Fig. 5.
Photomicrographs and Raman spectra illustrating the history of the CO/H2O mixture. (1) The sample at 0.4 GPa before irradiation. The a region is essentially fluid CO, whereas the solid fraction b is the clathrate hydrate (see Fig. 3). (2) The sample at the same pressure after 1 h 25 min of irradiation with 100 mW of the 350-nm line. The dark region is a recoverable solid product, and the Raman spectra measured in this sample region exhibit a strong fluorescence background. Molecular hydrogen and carbon dioxide are detected in the bubbles region. (3 and 4) (Line a) Spectrum measured at 0.4 GPa immediately after the loading. (Line b) Spectrum measured at the same pressure after 20 min of irradiation with 100 mW of the 350-nm line. (Line c) Reference spectrum of a H2/Ar mixture (5% H2 molar fraction) at 1.4 GPa.

