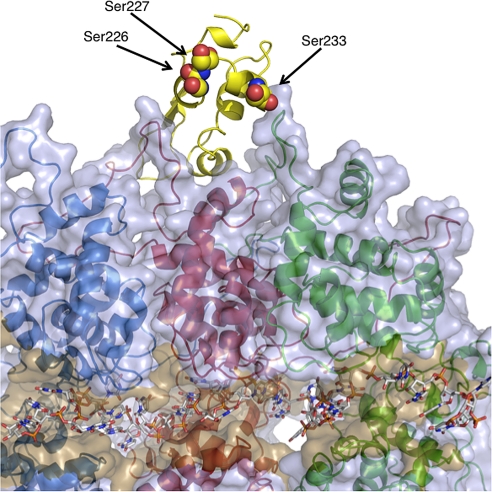
Fig. 4.
Phosphorylation of the P protein. Cartoon models of 3 molecules of the N protein (colored as in Fig. 1) are shown with encapsidated RNA (shown in stick representation). A semitransparent surface covering the 3 molecules of the N protein is shown in a shade of light blue, with the RNA cavity colored a darker shade of orange. The bound PCTD is shown in yellow. Residues that are phosphorylated are shown as space-filling spheres and are labeled accordingly. The perspective is the same as that in Fig. 1.

