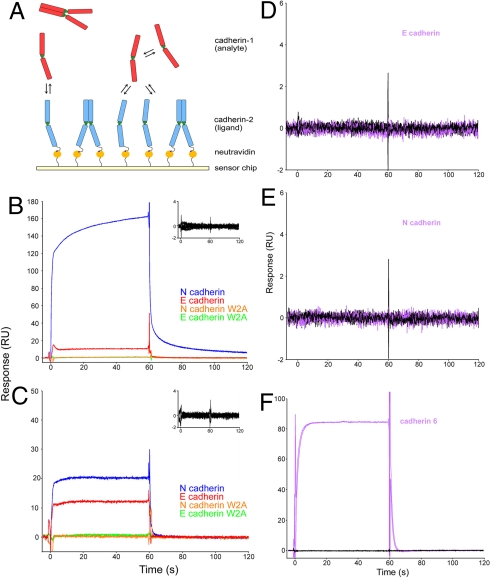
Fig. 3.
SPR binding experiments using N- and E-cadherins. (A) Biotinylated cadherin of a given type (ligand, shown in blue) was tethered over a neutravidin-coated sensor chip. Another cadherin of a given type (analyte, shown in red) was injected independently over the surface. The interaction between an analyte monomer (red) and the ligand monomer (blue) produces a binding signal. (B) N-cadherin (blue traces) and E-cadherin (red traces) were injected over a surface containing N-cadherin at 30 μM and 17 μM, respectively, which correspond to 13.1 μM free monomer. Each sample was injected in duplicate. N-cadherin W2A (orange traces) and E-cadherin W2A (green traces) mutants, which were also injected at the same monomer concentrations, show no binding. Inset shows an overlay of buffer blank injections performed throughout the experiment over the same surface. (C) During the same experiment, N- and E-cadherins were also injected over a surface containing E-cadherin, under the same conditions as described in B. Mouse cadherin-6 (purple traces) was injected at 121 μM (effective monomer concentration, 13.1 μM) over the same E-cadherin (D) and N-cadherin (E) surfaces. Black traces represent buffer blanks that were performed throughout the experiment. (F) To confirm that lack of binding was not due to an inactive protein, binding of cadherin-6 was tested against a cadherin-6 surface.

