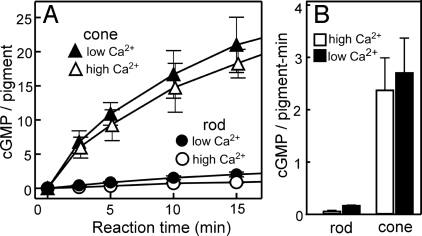
Fig. 1.
Time course of cGMP synthesis in rod and cone homogenates. (A) Time course of cGMP synthesis in rod (circles) and cone (triangles) homogenates measured at a high Ca2+ concentration (0.3 mM CaCl2, open symbols) and a low Ca2+ concentration (0.8 mM EGTA, filled symbols). The amount of cGMP synthesized is expressed as the number of cGMP molecules per visual pigment present and is plotted against time after addition of GTP. The result is shown as mean ± SD (n = 3). (B) Initial rates of cGMP synthesis in rod and cone homogenates calculated from the data in A at 2.5 min after addition of GTP.

