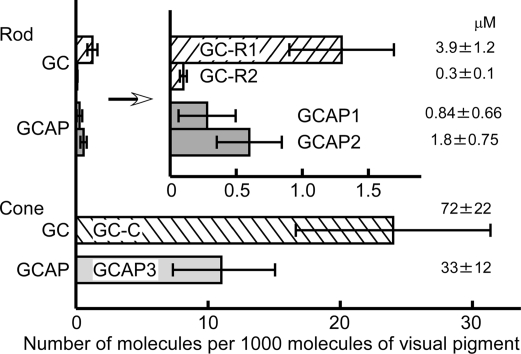
Fig. 2.
Quantification of GCs and GCAPs in rods and cones. Quantified expression levels of GC and GCAP in rods (upper half) and cones (lower half). The expression levels are shown as the number of molecules present per 1,000 visual pigment molecules. The concentration of each molecule was calculated based on the visual pigment concentration (3 mM) and is shown at the right of each bar.

