Fig. 4.
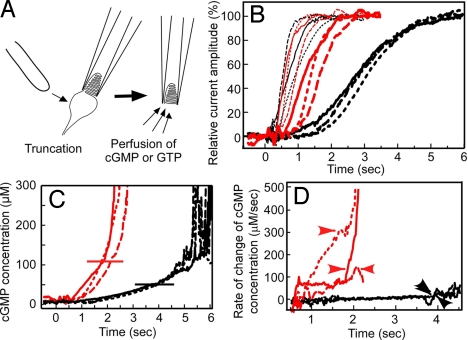
GC activity in tROS and tCOS. (A) Diagram illustrating the truncation and perfusion of tCOS. (B) Time course of generation of a current induced by perfusion of 1 mM cGMP (thin traces) or 1 mM GTP (thick traces) in a frog tROS (black traces) and a tCOS of carp red cone (red traces). Perfusion first with cGMP and then GTP was made for 3 tROS and 3 tCOS preparations. Traces of the same color and pattern (continuous, broken, or dotted lines) indicate that they were recorded in the same sample. The current amplitude is expressed as the percentage of the maximum. The maximum current obtained by perfusion with 1 mM GTP was similar to that obtained by 1 mM cGMP. (C) Calculated time course of the rise of the mean intracellular cGMP concentration in tROS (black traces) and tCOS (red traces) preparations. The mean cGMP concentration in the OS was estimated by applying a Hill equation to the current induced by GTP (see Higher GC Activity in Truncated COS Than in Truncated ROS). The horizontal line indicates the cGMP concentration that induces 80% of the maximum current. The pattern of a trace corresponds to that in B. (D) Time course of the rate of change of cGMP concentration. Based on the cGMP concentration increase shown in C, the rate of change of cGMP concentration was calculated in a 200-ms time window for tROS (black traces) and tCOS (red traces). Arrowhead indicates the rate in tCOS determined at the 80% saturation of the current. The pattern of a trace corresponds to those in B and C.

