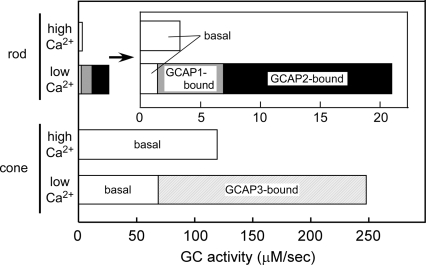
Fig. 5.
Estimation of GC activity in carp rods and cones in vivo. Total activity of GC was calculated from our present experimental results: expression levels of GCs and GCAPs in rods and cones (Fig. 2), the determined specific activity of GCAP-free and GCAP-bound form of a single GC molecule (Table 1), and determined Michaelis constant in each pair of GC and GCAP (Table 1). GC activity is expressed as the concentration of cGMP synthesized in ROS or COS per s. The white bar represents the GC activity brought about by its basal activity in rods and cones. The gray and black bars represent the activity of rod GCs of the GCAP1- and the GCAP2-bound forms, respectively. The hatched bar represents the activity of GCAP3-bound form of GC-C. The data in rods are shown as an inset with an expanded activity scale.

