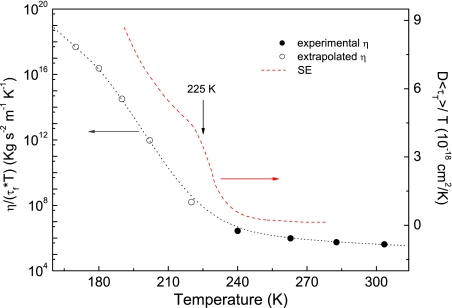
Fig. 5.
Breakdown of the DSE law. Data are compared with the SE breakdown from ref. 18. Filled dots refer to temperatures where experimental values of the viscosity are available. Open dots are based on a thermodynamic extrapolation of the viscosity (39). The line across the dots is a guide for the eye.

