Abstract
An approach to quantitatively study vesicle dynamics as well as biologically-related micro-objects in a fluid flow, which is based on the combination of a dynamical trap and a control parameter, the ratio of the vorticity to the strain rate, is suggested. The flow is continuously varied between rotational, shearing, and elongational in a microfluidic 4-roll mill device, the dynamical trap, that allows scanning of the entire phase diagram of motions, i.e., tank-treading (TT), tumbling (TU), and trembling (TR), using a single vesicle even at λ = ηin/ηout = 1, where ηin and ηout are the viscosities of the inner and outer fluids. This cannot be achieved in pure shear flow, where the transition between TT and either TU or TR is attained only at λ>1. As a result, it is found that the vesicle dynamical states in a general are presented by the phase diagram in a space of only 2 dimensionless control parameters. The findings are in semiquantitative accord with the recent theory made for a quasi-spherical vesicle, although vesicles with large deviations from spherical shape were studied experimentally. The physics of TR is also uncovered.
Understanding the rheology of biofluids remains a great challenge, whose progress relies, in a large part, on detailed studies of the dynamics of a single cell. Vesicles are a model system used to study the dynamic behavior of biological cells, similar in some respects to red blood cells, and their dynamics in shear flow have been the subject of intensive theoretical (1–8), numerical (9–13), and experimental (14–18) investigations.
A vesicle is a droplet of viscous fluid encapsulated by a phospholipid bilayer membrane suspended in a fluid of either the same or different viscosity as the inner one. Both the volume and the surface area of the vesicle are conserved. The former means that the vesicle membrane is considered to be impermeable, at least on the time scale of the experiment, and the latter means that the membrane dilatation is neglected since it is 2D fluid (1,2). Experimental, theoretical, and computational efforts during the last decade led to the observation and characterization of 3 states in vesicle dynamics in shear flow. The existence of the first 2, tank-treading (TT) and tumbling (TU), and the transition between them were already predicted by a phenomenological model of Keller and Skalak (19) and its further extensions (2,11,12). Two control parameters, the excess area Δ = A/R2-4π and the viscosity contrast λ = ηin/ηout, determine the transition line λc(Δ) between TT and TU, which is independent of the shear rate γ̇ in the approximation of a fixed vesicle shape, with the vesicle inclination angle θ with respect to the flow direction as the only dynamical variable (2,9,10,16–19). Here, R is the effective vesicle radius, related to the volume via V = 4/3πR3, A is the vesicle surface area, and ηin and ηout are the viscosities of the inner and outer fluids. Another analytical approach based on a quasi-spherical vesicle approximated by a spherical harmonics expansion used a perturbation scheme around the Lamb solution of the Stokes flow near a spherical body in external shear flow (1). Further refinement of the model resulted in dynamic equations for vesicle shape and inclination angle (3,4) and described rather well both the TT motion and the transition line λc(Δ), as verified by the recent experiments (16–18). However, the recent experimental key finding of a new type of unsteady motion, which we dubbed trembling (TR), led to reconsider both theoretical models (17). TR differs from TU by oscillations in θ of less than π/2 (rather than 2π) and by stronger vesicle shape deformations (3,17). Moreover, a new aspect is the dependence on γ̇ of the separate regions of existence of TR and TU (17). Precisely these features changed the idea of vesicle dynamics as smooth and shape-preserved motion and called for an adequate theoretical description. Several theoretical models were suggested to describe the dynamics of all 3 states in shear flow, their regions of existence, and transitions (5,7,13). As we have verified recently, only the 1 of them presented in ref. 5 describes adequately the experimental data (20). The main result of this model, which is based on the approximation of Δ≪1, second order spherical harmonics, and neglecting thermal noise, is a self-similar solution, which reduces the number of the dimensionless control parameters to just 2: S  7πγ̇ηoutR3/κΔ and Λ
  4(1 + 23λ/32)/, where κ is the bending elasticity [taken further as κ = 25 kBT≈10−12 erg (21)]. The phase diagram of the vesicle dynamical states is 2-dimensional, parameterized by the variables (S,Λ), and independent of other geometrical parameters. To scan all 3 regimes of motion and to trace transitions among them in a shear flow, one should vary both γ̇ and λ, that is change the viscosities of inner and outer fluids, which is an impossible task to realize on an individual vesicle. Because of topology of the phase diagram (5,20), the only remaining possibility with a single vesicle is to scan transitions from TU to TR by varying γ̇.
This limitation is overcome in a general flow, where the velocity gradient can be written as δiVk = sik + εikjωj, where sik is the symmetric strain tensor, ωj the vorticity vector, and s = the strain rate. The corresponding control parameters for vesicles in general flow (5) are S  14πsηoutR3/3κΔ and Λ = 4 (1 + 23λ/32)(ω/s)/. In this paper, we report the phase diagram in such general flow. This approach uses an additional control parameter ω/s, which is fixed to unity in shear flow (s = ω = γ̇/2), to study vesicle dynamics [it was suggested first by G. I. Taylor to study emulsions in a 4-roll mill (22)]. The ratio can be easily varied continuously in the experiment, evidencing transitions from TT to either TU or TR and from TU to TR on the same vesicle with given R, Δ, and λ. The experimental path across the phase diagram depends on the initial state and the way ω/s and s are varied. The possibility to observe all dynamical states with the same vesicle, even for λ = 1 used in the current experiment, complements the previous views based on the shear flow dynamics (2–4,7–20). On the other hand, the experimental approach used here will be advantageous to study the dynamics of other flexible microobjects, including biological membranes and red blood cells, in flow.
Results and Discussion
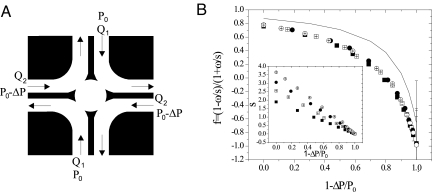
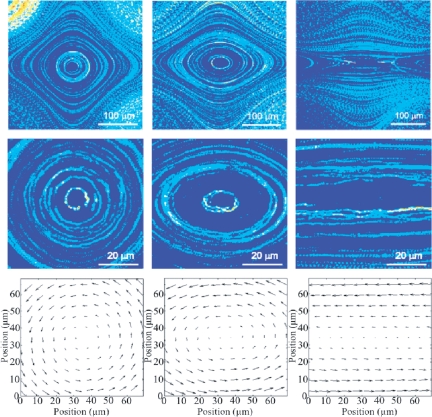
Measurements of the vesicle dynamics were conducted in a microfluidic 4-roll mill device (23,24) manufactured in silicone elastomer by soft lithography (Fig. 1). Particle tracking velocimetry (PTV) measurements show fair agreement with numerical simulations and high flow uniformity (Fig. 2 and SI Appendix). The accessible range of s was [0.05–0.32] s−1 and that of ω/s was [1.18–9.23]. To reduce error bars on S and Λ, the geometrical parameters R and Δ of each vesicle were measured in situ from a 3D reconstruction of its shape (20) in TT motion at low S, with mean errors of 1.7% on R and of 6.1% on Δ within the range [0.3, 2.5]. Since only vesicles with λ = 1 were used in this work, there is no error contribution from this parameter (20). Errors from non-uniformity of the velocity field were below 2%; that cumulates to overall mean errors of 8.7% on S and of 2% on Λ.
Fig. 1.
(A) Schematic of the microfluidic 4-roll mill device; Q1 and Q2 are the flow discharges, whose ratio defines the flow type. The flow is driven by gravity, and the ratio between the pressure drop P0 and the pressure difference between 2 inlets ΔP determines Q1/Q2. (B) f = (1 − ω/s)/(1+ ω/s) as a function of the reduced pressure drop (1- ΔP/P0). Inset: s as a function of (1 − ΔP/P0). Large filled squares, P0 = P; open squares, P0 = 4/3P; small filled circles, P0 = 5/3P, open circles, P0 = 2P (in our specific configuration P≈750 Pa). The solid line is the 3D FEM simulation of the flow. Experimental imperfections due to soft lithography lead to observable quantitative discrepancy with simulations.
Fig. 2.
(A) Experimental streamlines images of the velocity fields for pure rotational (first column, ω/s = 43), mixed (second column, ω/s = 2.6) and pure shear (third, ω/s = 1) flows; (B) Zoom of the same experimental flows; (C) velocity vector field representation of the same flows (PTV).
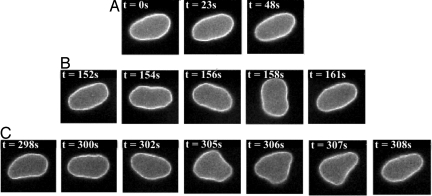
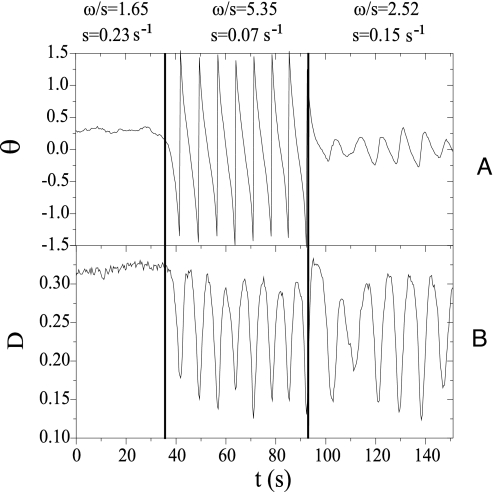
The experiments were performed in the following way. A vesicle with given R and Δ, measured initially in situ in the same device, was followed at a prescribed value of ω/s and s in the observation window. A feedback in the flow velocity was used to hold a vesicle in the field of view for up to 10 TU/TR periods. To explore the whole space of parameters (S, Λ), vesicles with various values of R and Δ were loaded and individually observed, and ω/s was varied in steps during the experiment by changing ΔP, which is the pressure difference between 2 inlets (see Fig. 1). In this way the space of parameters (S, Λ) was populated with experimental points, scanned along a particular path. We identified the different dynamic regimes as follows. The cross-section shape of the vesicle observed is instantaneously fitted by an ellipse. If the inclination angle θ of its major axis was substantially constant in time and positive, the vesicle was considered in TT. If the axis rotated complete turned, the regime was TU. If θ oscillated around 0, with excursion of less than π/2, the vesicle was said to be in TR motion (Fig. 3 and Movie S1). In Fig. 4, we present as an example the dynamics of a single vesicle observed first in TT, and then driven to TU and further to TR, while ω/s and s vary, as characterized by the time dependencies of θ and of the aspect ratio D.
Fig. 3.
Dynamical states of a vesicle with R = 6.19 μm and Δ = 0.82 during (A) tank-treading: ω/s = 1.7, s = 0.22 s−1, S = 6.8, Λ = 1.09; (B) tumbling: ω/s = 5.3, s = 0.07 s−1, S = 2.17, Λ = 3.4; (C) trembling: ω/s = 3.1, s = 0.12 s−1, S = 3.71, Λ = 1.99.
Fig. 4.
Transition of a vesicle from TT to TU and further to TR due to variations of ω/s and s. (A) θ versus time. (B) D = (L-B)/(L+B) versus time. L and B are the large and small semiaxis of the elliptical approximation of vesicle. R = 14.4 μm, Δ = 0.64.
In TU and TR, a vesicle experiences periodical stretching and compression, which lead to its shape deformations. The 2 constraints that considerably complicate the description of vesicle dynamics, namely the conservation of volume and surface area, play a determinant role particularly in TR dynamics. The fixed V and A do not define uniquely the vesicles shape. Strong shape deformations can occur only through a concave vesicle shape attained during compression, which is associated with a negative surface tension. One can expect the appearance of an instability, manifesting itself in the generation of higher order shape harmonics, similar to the wrinkling instability observed in a time-dependent elongation flow (25,26). Indeed, a significant third order harmonic was observed in TR at all values of S studied (see Fig. 3), and a fourth and a fifth at larger S. Strong sensitivity to thermal noise due to instability during each TR cycle is also expected. Larger shape deformations in TR are explained by larger s (smaller ω/s), which is responsible for the deformations, than in TU. The deformed vesicle shapes in TR shown in images in Fig. 3 strikingly differ from those shown in snapshots of the vacillating breathing mode suggested theoretically in ref. 3.
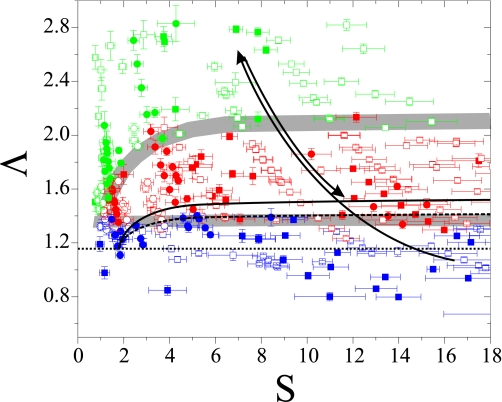
In Fig. 5 we plot our data in the form of a phase diagram, identifying the different dynamical regimes attained by different vesicles for parameters spanning the (S,Λ)-plane. The gray bands separate regions with different dynamics. The lines separating the 3 regimes, TT, TR, and TU, predicted theoretically, taken from ref. 5, are also shown. Distinct dynamical regimes are experimentally indeed attained in definite regions of S and Λ in the parameter plane, while no correlation with the value of Δ of the vesicles is seen. This agrees with the self-similar parameterization of the vesicle dynamics suggested in ref. 5. The experimental phase diagram shows the same topological structure of the phase diagram of the theory; however, the experimental TR region is wider and globally shifted slightly upward in Λ and leftward in S. These discrepancies could have several causes. First, the vesicles we observed had large values of Δ, while the theory was developed for nearly spherical vesicles, i.e., for Δ≪1. Second, thermal noise is not taken into account within the theory, whereas vesicles observed in the experiment showed both strong deviations from the spherical shape and significant thermal membrane fluctuations. Third, the description of the vesicle dynamics in ref. 5 includes only up to the second order spherical mode. Even if these assumptions may not be too binding for what we observe in the TT and TU motions, the higher order modes are clearly involved in the dynamics of TU and particularly of TR motions (see Fig. 3 B and C).
Fig. 5.
Phase diagram of the vesicle dynamical states in general flow: green symbolizes-TU, red-TR, and blue-TT. Gray bands are guides for the eye. Dotted, dashed, and solid black lines are the theoretical boundaries between TT, TU, and TR, respectively (5). Large filled squares, Δ ∈ [0–0.8]; open squares, ∈ [0.8–1.3]; small filled squares, ∈ [1.3–1.8]; open circles, ∈ [1.8–2.6]. Two black arrows indicate the experimental path through the dynamical states followed by the vesicle presented in Fig. 4.
Conclusions
An experimental approach, which provided an experimental diagram of the vesicles dynamics in a general flow, has been developed. The experimental results are in good qualitative agreement with the theory (5), showing distinct vesicle dynamical states well separated on the phase diagram described by just 2 dimensionless parameters, S and Λ. On the other hand, the theory was developed by neglecting thermal noise and under the assumptions that Δ≪1 and only second order spherical harmonics present in the vesicle shape deformations, whereas vesicles with Δ≈O (1) and higher order harmonics shape deformations were observed in the experiment. Thus, the puzzle remains: how does the self-similar solution prevail up to Δ≈O (1) and with higher order harmonics shape deformations?
Materials and Methods
Vesicles were prepared by the electro-formation method (27). The lipid solution consisted of 85% DOPC (Sigma) and 15% NBD-PC (fluorescent lipid, Molecular Probes) dissolved in 9:1 vol/vol chloroform-methanol solvent (1.8 mg/mL total lipid/mL). The details of preparation have been described previously (16). To achieve λ = 1, inner and outer fluids were the same: 9.3% wt/wt of sucrose in water with ηout = 1.26 × 10⁻³ Pa.s. The rheological measurements were carried out on a viscometer Vilastic-3. Vesicles were imaged over an observation area 65 × 65 μm2 at the middle height of the channel; images were captured by Mintron MTV-12V6HC CCD camera and digitized via Ellips Rio frame grabber. Illumination by a metal-halide-lamp was mechanically chopped and synchronized with the frame grabber, to decrease the exposure time and to reduce photobleaching, and allowed to capture images of vesicles with velocities up to hundreds of micrometers per second without noticeable smearing. Image acquisition and motor control were performed under Labview, while image processing was carried out with Matlab.
Supplementary Material
Acknowledgments.
We thank V. Lebedev (Landau Institute for Theoretical Physics, Moscow, Russia), S. Vergeles (Landau Institute for Theoretical Physics, Moscow, Russia), and N. Zabusky (Weizmann Institute of Science, Rehovot, Israel), for helpful suggestions and criticism. This work is partially supported by the grants of the Israel Science Foundation, the Minerva Foundation, and the Minerva Center for Nonlinear Physics of Complex Systems.
Footnotes
The authors declare no conflict of interest.
This article is a PNAS Direct Submission.
This article contains supporting information online at www.pnas.org/cgi/content/full/0902657106/DCSupplemental.
References
- 1.Seifert U. Fluid membranes in hydrodynamic flow fields: Formalism and an application to fluctuating quasi-spherical vesicles in shear flow. Eur Phys J B. 1999;8:405–415. [Google Scholar]
- 2.Rioual F, Biben T, Misbah C. Analytical analysis of a vesicle tumbling under a shear flow. Phys Rev E. 2004;69 doi: 10.1103/PhysRevE.69.061914. 061914. [DOI] [PubMed] [Google Scholar]
- 3.Misbah C. Vacillating breathing and tumbling of vesicles under shear flow. Phys Rev Lett. 2006;96 doi: 10.1103/PhysRevLett.96.028104. 028104. [DOI] [PubMed] [Google Scholar]
- 4.Vlahovska P, Gracia R. Dynamics of a viscous vesicle in linear flows. Phys Rev E. 2007;75 doi: 10.1103/PhysRevE.75.016313. 016313. [DOI] [PubMed] [Google Scholar]
- 5.Lebedev V, Turitsyn K, Vergeles S. Dynamics of nearly spherical vesicles in an external flow. Phys Rev Lett. 2007;99:218101. doi: 10.1103/PhysRevLett.99.218101. [DOI] [PubMed] [Google Scholar]
- 6.Lebedev V, Turitsyn K, Vergeles S. Nearly spherical vesicles in an external flow. New J Physics. 2008;10 doi: 10.1103/PhysRevLett.99.218101. 043044. [DOI] [PubMed] [Google Scholar]
- 7.Danker G, et al. Dynamics and rheology of a dilute suspension of vesicles: Higher-order theory. Phys Rev E. 2007;76 doi: 10.1103/PhysRevE.76.041905. 041905. [DOI] [PubMed] [Google Scholar]
- 8.Finken R, Lamura A, Seifert U, Gompper G. Two-dimensional fluctuating vesicles in linear shear flow. Eur Phys J E. 2008;25:309–321. doi: 10.1140/epje/i2007-10299-7. [DOI] [PubMed] [Google Scholar]
- 9.Biben T, Misbah C. Tumbling of vesicles under shear flow within an advected-field approach. Phys Rev E. 2003;67 doi: 10.1103/PhysRevE.67.031908. 031908. [DOI] [PubMed] [Google Scholar]
- 10.Beaucourt J, et al. Steady to unsteady dynamics of a vesicle in a flow. Phys Rev E. 2004;69 doi: 10.1103/PhysRevE.69.011906. 011906. [DOI] [PubMed] [Google Scholar]
- 11.Noguchi H, Gompper G. Fluid vesicles with viscous membranes in shear flow. Phys Rev Lett. 2004;93:258102. doi: 10.1103/PhysRevLett.93.258102. [DOI] [PubMed] [Google Scholar]
- 12.Noguchi H, Gompper G. Dynamics of fluid vesicles in shear flow: Effect of membrane viscosity and thermal fluctuations. Phys Rev E. 2005;72 doi: 10.1103/PhysRevE.72.011901. 011901. [DOI] [PubMed] [Google Scholar]
- 13.Noguchi H, Gompper G. Swinging and tumbling of fluid vesicles in shear flow. Phys Rev Lett. 2007;98:128103. doi: 10.1103/PhysRevLett.98.128103. [DOI] [PubMed] [Google Scholar]
- 14.de Hass K, et al. Deformation of giant lipid bilayer vesicles in shear flow. Phys Rev E. 1997;56:7132–7137. [Google Scholar]
- 15.Abkarian M, Lartigue C, Viallat A. Tank-treading and unbinding of deformable vesicles in shear flow: Determination of the lift force. Phys Rev Lett. 2002;88 doi: 10.1103/PhysRevLett.88.068103. 068103. [DOI] [PubMed] [Google Scholar]
- 16.Kantsler V, Steinberg V. Orientation and dynamics of a vesicle in tank- treading motion in shear flow. Phys Rev Lett. 2005;95:258101. doi: 10.1103/PhysRevLett.95.258101. [DOI] [PubMed] [Google Scholar]
- 17.Kantsler V, Steinberg V. Transition to tumbling and two regimes of tumbling motion of a vesicle in shear flow. Phys Rev Lett. 2006;96 doi: 10.1103/PhysRevLett.96.036001. 036001. [DOI] [PubMed] [Google Scholar]
- 18.Mader M-A, et al. Dynamics of viscous vesicles in shear flow. Eur Phys J E. 2006;19:389–397. doi: 10.1140/epje/i2005-10058-x. [DOI] [PubMed] [Google Scholar]
- 19.Keller SR, Skalak R. Motion of a tank-treading ellipsoidal particle in a shear flow. J Fluid Mech. 1982;120:27–47. [Google Scholar]
- 20.Deschamps J, Kantsler V, Steinberg V. Phase diagram of single vesicle dynamical states in shear flow. Phys Rev Lett. 2009;102:118105. doi: 10.1103/PhysRevLett.102.118105. [DOI] [PubMed] [Google Scholar]
- 21.Rawicz W, et al. Needham effect of chain length and unsaturation on elasticity of lipid bilayers. Biophys J. 2000;79:328–339. doi: 10.1016/S0006-3495(00)76295-3. [DOI] [PMC free article] [PubMed] [Google Scholar]
- 22.Taylor GI. The formation of emulsions in definable fields of flow. Proc R Soc London. 1934;A146:501–523. [Google Scholar]
- 23.Hudson SD, et al. Microfluidic analog of the four-roll mill. Appl Phys Lett. 2004;85:335–337. [Google Scholar]
- 24.Lee JC, et al. Microfluidic four-roll mill for all flow types. Appl Phys Lett. 2007;90 074103. [Google Scholar]
- 25.Kantsler V, Segre E, Steinberg V. Vesicle dynamics in time-dependent elongation flow: Wrinkling instability. Phys Rev Lett. 2007;99:178102. doi: 10.1103/PhysRevLett.99.178102. [DOI] [PubMed] [Google Scholar]
- 26.Turitsyn K, Vergeles S. Wrinkling of vesicles during transient dynamics in elongational flow. Phys Rev Lett. 2008;100 doi: 10.1103/PhysRevLett.100.028103. 028103. [DOI] [PubMed] [Google Scholar]
- 27.Angelova M, et al. Preparation of giant vesicles by external AC fields. Prog Colloid Polym Sci. 1992;89:127–131. [Google Scholar]
Associated Data
This section collects any data citations, data availability statements, or supplementary materials included in this article.


