
Figure 2.
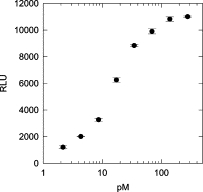
Detection of MBP-FMRP using sandwich ELISA. A dose-response curve of RLUs plotted as a function of log MBP-FMRP concentration. RLU, based on light collected over 2.5 seconds.
Official websites use .gov
A
.gov website belongs to an official
government organization in the United States.
Secure .gov websites use HTTPS
A lock (
) or https:// means you've safely
connected to the .gov website. Share sensitive
information only on official, secure websites.
Detection of MBP-FMRP using sandwich ELISA. A dose-response curve of RLUs plotted as a function of log MBP-FMRP concentration. RLU, based on light collected over 2.5 seconds.