
Figure 2.
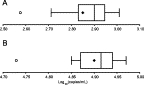
RealTime control values. Box-and-whisker plots for the RealTime controls are shown for each run (n = 17) versus their expected values (diamond markers). A: Low positive control = 2.85 log10 copies/ml; and B: High positive control = 4.90 log10 copies/ml). Open circles indicate “mild outliers” (between 1.5 and 3 times the interquartile range lower than the first quartile). The negative control was “Not Detected” in all seventeen runs. The control values from both the 1 ml and 0.5 ml assays are included.