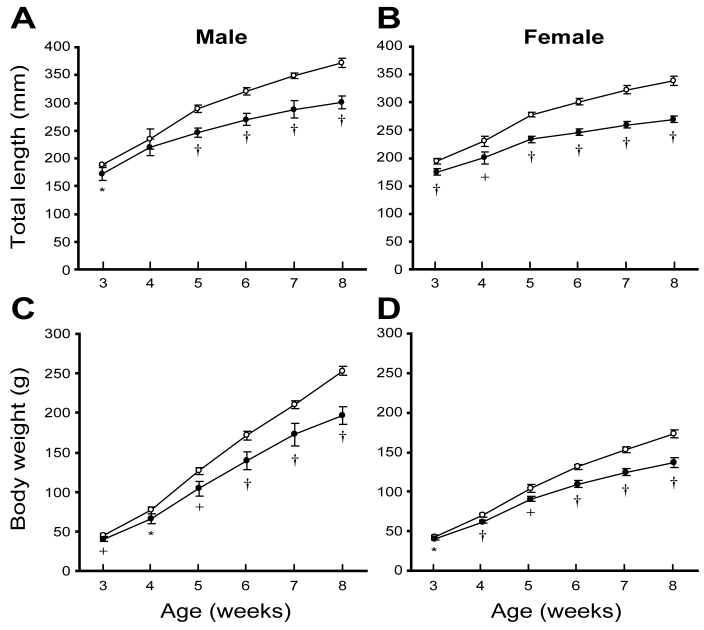
Figure 2.
Growth curves for (A and B) total lengths and (C and D) body weights of the KMI strain. Values shown are mean ± SD (n = 5). Open circles, heterozygous (mri/+) animals; filled circles, homozygous mutant (mri/mri) animals. *, P < 0.05; +, P < 0.01; †P < 0.001 versus values for heterozygous animals.

