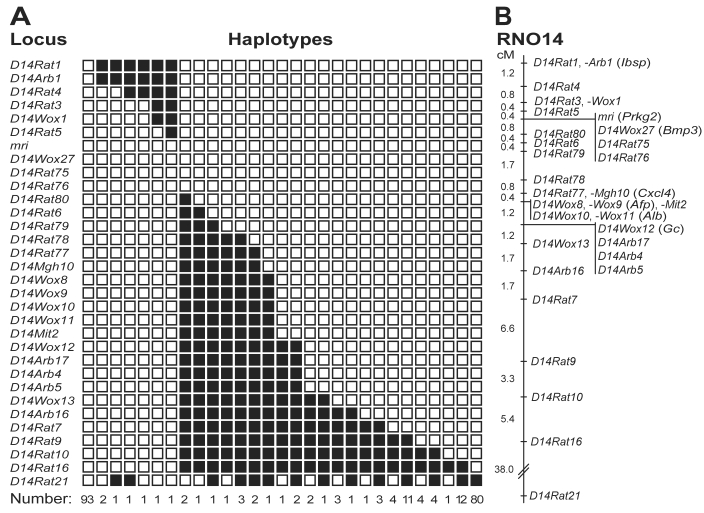
Figure 4.
Genetic linkage mapping of the mri mutation. (A) Distribution of haplotypes for rat chromosome 14 in 241 (BN×KMI)F1×KMI backcrossed progeny with the KMI phenotype. Black boxes, heterozygosity for the BN allele; white, homozygosity for the KMI allele. (B) Genetic linkage map of rat chromosome 14 including the mri (Prkg2) locus. Distances between loci (cM) are shown on the left.

