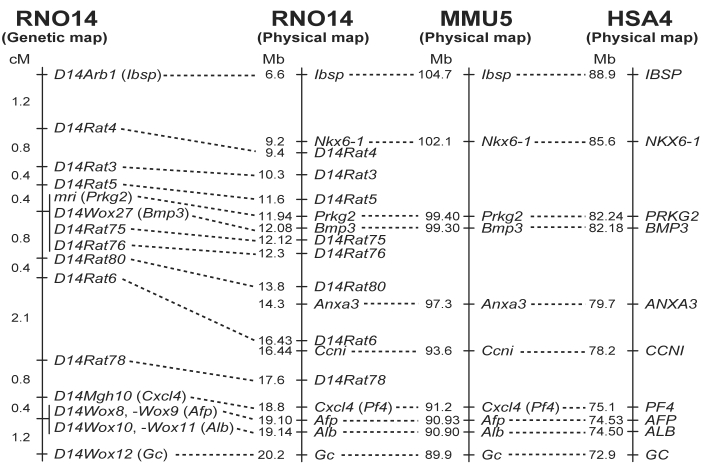
Figure 5.
Comparative map of the mri region in the rat, mouse, and human. The comparative map of rat chromosome 14 (RNO14), mouse chromosome 5 (MMU5), and human chromosome 4 (HSA4) was constructed based on data obtained in this study and information from several databases (see text for details). Distances between loci (cM) are shown to the left of the genetic map. Physical map positions (Mb) of loci are shown to the left of each physical map.

