
Fig. 1.
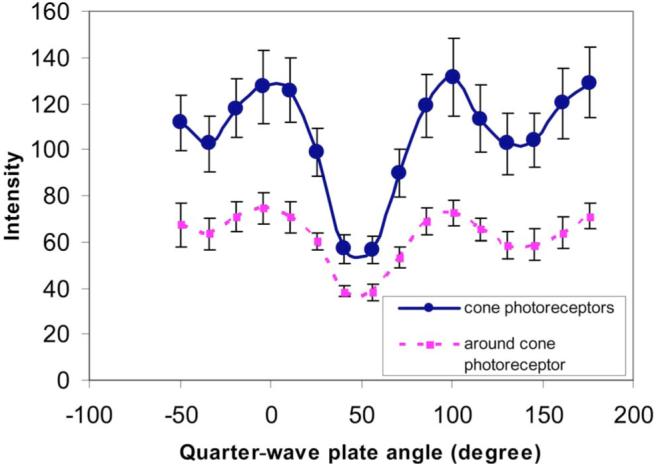
(Color online) Systematic variation of the intensities of cone photoreceptors and area around cone photoreceptors from one subject at 6° of the nasal retina with respect to the orientation of the quarter-wave plate. Error bars are the standard deviation across locations.