
Fig. 2.
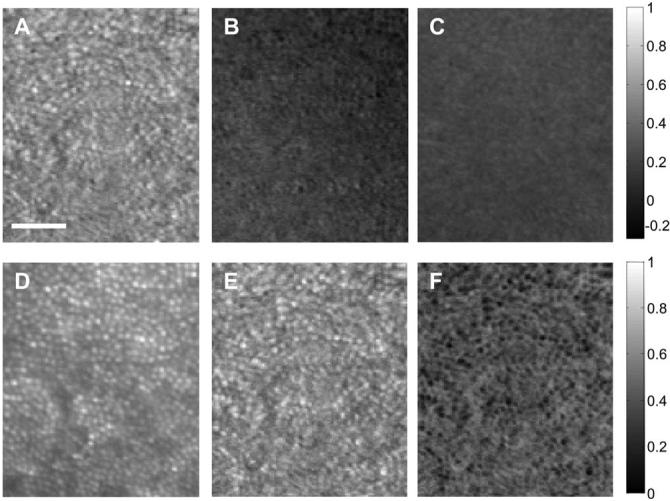
Stokes vector images at 6° on the nasal retina from the same subject as in Fig. 1. Top row, images formed by S1-S3; bottom row, intensity image (S0), DOP image, and DODP image. Scale bar is 50 μm. The gray-level code is shown at the right side.