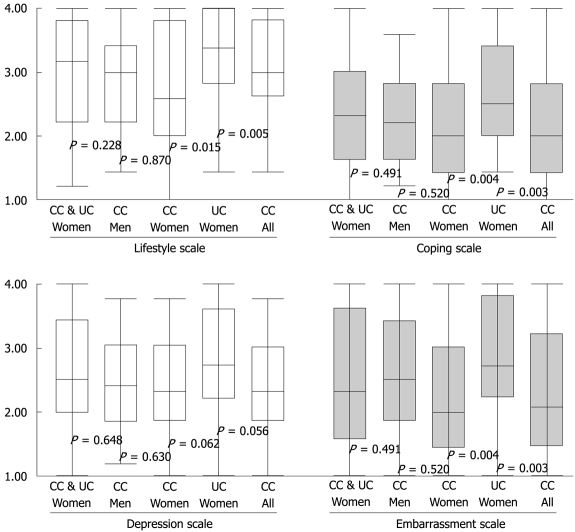
Figure 1.
Association of FIQL scales with sex and CC and UC. FIQL, Rockwood et al[22]; Box and whisker demonstrates median, IQR, minimum and maximum. P values calculated by unpaired Wilcoxin test (Mann-Whitney); QOL score of 1 represents very low functional status and 4 is not affected by FI; FIQL scales calculated as per letter to the editor, Rockwood[26].

