
Figure 2.
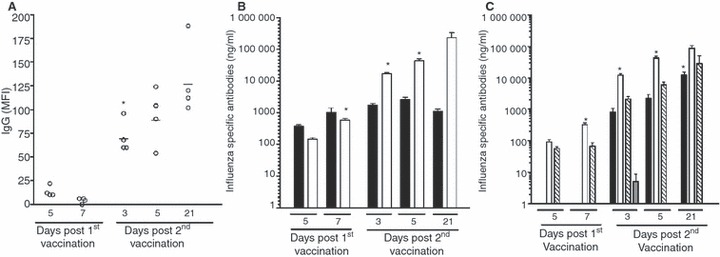
The antibody response induced after vaccination. BALB/c mice were immunised with one or two doses of whole virus vaccine (15 μg total protein). Groups of four mice were sacrificed after vaccination and the serum analysed by luminex bead‐based assay and ELISA. (A) The IgG antibody response induced after vaccination. Beads coated with whole H7N1 virus were used to measure the kinetics of the IgG response in a bead based immunoassay. Data are presented as the mean fluorescent intensity (MFI) of each mouse and the line shows the mean MFI of the group of animals on each day after vaccination. The MFI increased significantly (*, P < 0·05) after the second dose of vaccine. (B) An ELISA assay was used to measure the IgM (black) and IgG (open) serum antibody concentrations. The data are presented as the mean concentration (μg/ml) ± SEM after immunisation. Statistically significant increases (P < 0·05) from the preceding group are indicated by an asterisk (*). (C) The serum IgG subclass distribution after vaccination. The concentration of IgG1 (black) IgG2a (white), IgG2b (striped) and IgG3 (grey) are shown as the mean concentration (μg/ml) ± SEM. Statistically significant increases (P < 0·05) from the preceding group are indicated by an asterisk (*) for the IgG1 and IgG2a subclasses.