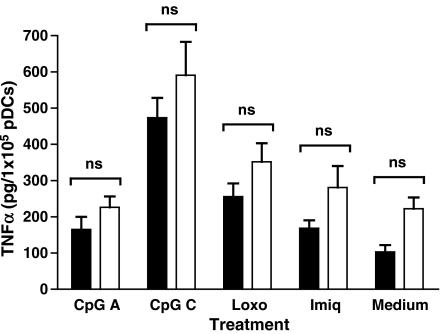
Fig. 3.
TLR7 and TLR9 agonists induce normal levels of TNF-α production in pDCs from chronically HCV-infected subjects. pDC supernatants from a subset of the NHD and cHCV subjects shown in Fig. 2 were additionally assayed for the presence of TNF-α, yielding the following data sets: medium alone (NHD, n=10; cHCV, n=15), 1 μm CpG-A ODN (NHD, n = 9; cHCV, n=9), 1 μm CpG-C ODN (NHD, n=9; cHCV, n=10), 250 μm loxoribine (NHD, n=10; cHCV, n=11) and 5 μm imiquimod (NHD, n=10; cHCV, n=9). Bars represent means ± SEM; NHD (solid bars), CHC (open bars). Compared to cells exposed to medium alone, TNF-α was significantly induced only by CpG-C (P<0.001). In both NHD- and cHCV-pDCs, CpG-C induced significantly more TNF-α than CpG-A (P<0.001), loxoribine (P<0.01) or imiquimod (P<0.001). The response of NHD- and cHCV–pDCs to individual agonists did not differ significantly (n.s.).

