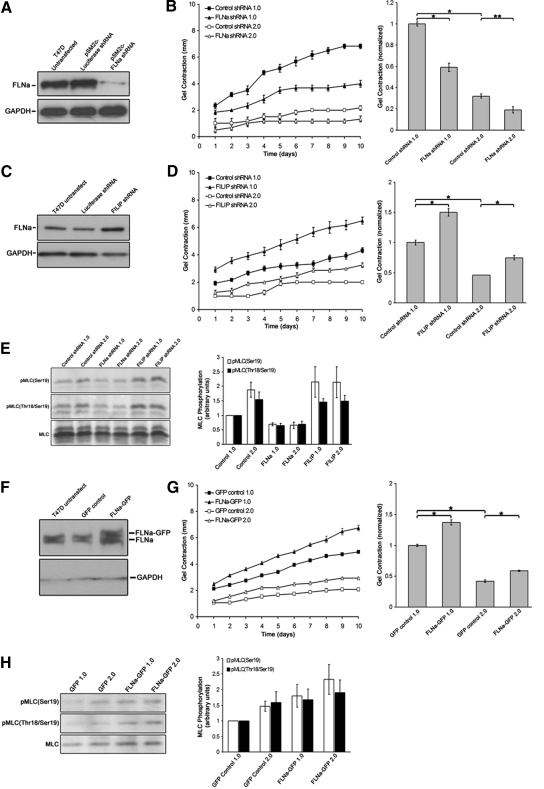
Figure 2.
Filamin levels control the extent of collagen gel contraction and MLC phosphorylation. (A) Stable expression of FLNa shRNA reduced FLNa in T47D cells, demonstrated by Western blot analysis. GAPDH was used as a loading control. (B) Cells expressing FLNa shRNA exhibited a 42 and 38% reduction in gel contraction by day 10 when cultured in low- or high-density gels, respectively, relative to vector control for each collagen concentration. Data are represented over 10 d and are graphed as a mean for day 10 ± SEM for six experiments. *p < 0.001, **p < 0.01 statistical difference (two-sample t test). (C) Endogenous FLNa levels were increased by stably expressing FILIP shRNA, as demonstrated by Western blot with anti-FLNa antibodies. (D) Expression of FILIP shRNA increased gel contraction over 10 d, and by day 10 there was an increase of ∼50 and 62% in low- and high-density floating gels, respectively, relative to control cells for each collagen concentration. Bar graphs represent the mean ± SEM for at least eight experiments. *p < 0.001 statistical difference (two-sample t test). (E) Perturbing FLNa levels down or up regulates myosin activity, as measured by pMLC. T47D cells expressing FLNa shRNA exhibited a 65–70% reduction in pMLC(Ser19) and pMLC(Thr18/Ser19), whereas FILIP shRNA-expressin cells exhibited a 45–115% increase in pMLC(Ser19) and pMLC(Thr18/Ser19) in both low- and high-density gels. Note that increased FLNa expression enhanced pMLC above that observed in control cells. Graphed data represent the mean ± SEM for at least six experiments. p < 0.05 for all cell types and conditions; statistical difference compared with low-density control (two-sample t test). (F) Overexpression of FLNa-GFP in T47D cells was confirmed by Western blot analysis. Expression of FLNa-GFP did not alter expression of endogenous FLNa. (G) Expression of FLNa-GFP enhances matrix contraction. FLNa-GFP enhanced gel contraction in both low and high-density floating gels, similar to FILIP shRNA. Data expressed over 10 d and graphed at day 10, representing the mean ± SEM for 15 experiments. *p < 0.001 statistical difference (two-sample t test). (H) Cells expressing FLNa-GFP exhibit increased pMLC(Ser19) and pMLC(Thr18/Ser19) levels in both low and high-density gels. Note that expression of FLNa-GFP enhanced pMLC above that observed in control cells. Graphs represent the mean from 10 experiments ± SEM p < 0.05 for all experimental conditions; statistical significance relative to low-density control (two-sample t test).

